KPI: Japanese Candlestick Patterns
Pattern Recognition: The Japanese Candlesticks KPI
The Japanese Candlesticks KPI is an advanced pattern recognition engine designed to analyze price action structure. While standard charting tools display raw price data, this KPI analyzes the composition of individual candles to identify potential shifts in market sentiment.
Our algorithm scans for a curated list of technical patterns, ranging from classic reversals to complex structure signals such as liquidity tests and volume divergences. By identifying these patterns automatically, the system provides traders with technical data regarding potential trend continuation or reversal.
1. How the Engine Works
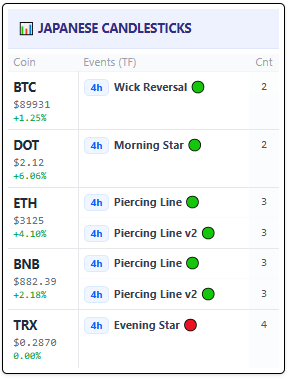
The scanner monitors the live price feed across multiple timeframes. Beyond simple shape recognition, it calculates the relationship between body size, wick length, and volume to validate the technical definition of a pattern. When a match from the CANDLE_INCLUDE_LIST is found, it is displayed on the dashboard with a sentiment label (Bullish 🟢 or Bearish 🔴).
2. Scanned Patterns & Technical Definitions
The system specifically scans for the following technical structures:
Reversal Patterns
- Morning Star (v9) & Evening Star (v5/v9): Multi-candle reversal patterns. The “v9” and “v5” designations signify specific algorithmic criteria regarding volume and body size that must be met for validation.
- Engulfing (Bull/Bear): A momentum pattern where the current candle’s range completely encompasses the previous one, often interpreted as a shift in directional control.
- Piercing Bull (v1/v2): A bullish reversal pattern where the price closes significantly above the midpoint of the preceding bearish candle.
- Outside Bar (Bull/Bear): A volatility pattern where the high and low of the candle exceed the previous candle’s range, signaling expansion.
Liquidity & Structural Patterns
- Liquidity Grab (c_liqgrab_bull/bear): These patterns identify long wicks that briefly breach a structural level before closing back within the range. In technical analysis, this is often interpreted as a test of liquidity or “stop hunt.”
- Bear Trap (v3): A specific pattern identifying a false breakdown that fails to sustain lower prices, potentially trapping short positions.
- Wick Reversal (c_wickrev_bull): Specifically monitors long wicks that signal a strong rejection of lower price levels.
Advanced Divergence & Dynamic Patterns
- Dark Cloud Cover (c_dcc_adv2/confirm): A bearish reversal pattern identifying potential exhaustion at the top of a trend. The “Adv2” and “Confirm” versions require secondary verification candles.
- Standard Divergence (c_div_bull/bear): Identifies a mismatch between price trajectory and internal momentum indicators.
- Volume Divergence (c_voldiv_bull/bear): A volume-based indicator that flags when price direction contradicts volume flow, often technically interpreted as a weakening trend.
3. Integration with MMS V2
The Japanese Candlestick signals serve as a specific input for the MMS (Market Macro Score):
- Confirmation Logic: If the MMS is in a Growth regime and the Candlestick KPI detects a high-grade reversal pattern (e.g., c_morning_star_v9), the algorithm increases its internal confidence weighting.
- Risk Warning: If the MMS is Bullish but a bearish structure (like c_liqgrab_bear or c_voldiv_bear) appears on significant timeframes (e.g., 4h), the system logic may trigger a REDUCE_EXPOSURE status to reflect increased technical risk.
Educational Note: Traders often pay special attention to the “v9” and “v5” versions of the star patterns. In the context of this software, these versions apply stricter filtering criteria than standard definitions, designed to highlight patterns with specific structural characteristics.
⚠️ RISK WARNING & AI DISCLOSURE
- This information is generated by Artificial Intelligence (AI) and complex algorithms. While advanced, these systems can contain errors or inaccuracies and are for educational purposes only.
- Technical analysis provides no guarantees; this information is purely informative.
- All discussed scenarios are hypothetical and do not constitute predictions or expectations.
- Past performance is not an indicator of future results.
- This is not financial advice and is not intended as a call-to-action for the reader.
- No implicit direction is claimed, and no specific behavior of market participants is suggested.