KPI: AB (Alt Breadth)
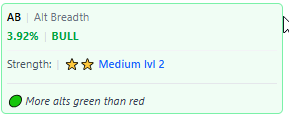
Market Participation Analysis: The Alt Breadth (AB) Indicator
The Alt Breadth (AB) KPI is an analytical indicator designed to measure the overall participation of the broader cryptocurrency market. While standard analysis often focuses on Bitcoin’s price action, the AB indicator assesses the performance of the alternative asset sector.
This metric helps analysts determine whether a price movement is supported by the collective market (broad participation) or if the action is limited to specific assets (narrow participation).
1. What does AB measure?
The AB indicator calculates the average performance (typically the 24-hour price change) of a broad basket of tracked altcoins.
- Market Participation: It reveals the “breadth” of the trend. If Bitcoin is rising but the AB value is negative, it indicates that altcoins are statistically failing to follow the lead.
- Capital Flows: It functions as a gauge for capital rotation. A rising AB value is technically interpreted as capital flowing into the broader ecosystem.
2. Interpreting the Scores
The AB value is displayed with a numerical score and color-coded status indicators to assist in trend assessment:
🟢 Positive AB (High Breadth)
- Technical State: The majority of tracked assets are increasing in value.
- Interpretation: This indicates broad market support. In market theory, trends with high breadth are often viewed as more sustainable because they are driven by widespread demand rather than isolated movement.
🔴 Negative AB (Low Breadth)
- Technical State: The broad altcoin market is declining or underperforming.
- Interpretation: Even if the market leader (Bitcoin) is rising, a negative AB points to “divergence.” This suggests that the rally is narrow, driven potentially by capital fleeing altcoins into Bitcoin rather than new capital entering the system.
⚪ Neutral AB (Balance)
- Technical State: Gainers and losers are roughly equal.
- Interpretation: The market is in a state of equilibrium or consolidation with no clear sectoral trend.
3. Analytical Utility
Recognizing the “quality” or internal strength of a trend is the primary application of this KPI:
Broad-Based Trend (Price Up + Positive AB)
- Context: Price action is supported by the majority of the market. This alignment is often sought by traders looking for sector-wide momentum.
Narrow Breadth / Divergence (Price Up + Negative AB)
- Context: Bitcoin rises while the average altcoin falls.
- Risk Assessment: Technical analysts often view this as a risk signal. History suggests that rallies driven solely by one asset (without broad support) may be more susceptible to volatility if that single asset corrects.
4. Integration with MMS V2
Within the MMS (Market Macro Score) algorithm, the AB value serves as a logic gate for determining market regimes:
- Rotation Logic: When the MMS identifies an “Alt Rotation” phase, a high AB value is required as data confirmation.
- Regime Validation: The system classifies an environment as fully “Risk-On” only when the AB value confirms that risk appetite is present across the broader spectrum of assets, not just the market leader.
5. Relationship with BTC Dominance
The AB indicator acts as a data counterpart to Bitcoin Dominance (BTC.D).
- Rotation Phase: When the AB value rises while Bitcoin Dominance declines, it signals that altcoins are outperforming Bitcoin. In crypto market cycles, this is commonly referred to as “Altseason” (capital rotation).
- Consolidation Phase: When the AB value falls while Bitcoin rises, Bitcoin Dominance increases. This signals a concentration of liquidity into the market leader, often seen during periods of uncertainty.
⚠️ RISK WARNING & AI DISCLOSURE
- This information is generated by Artificial Intelligence (AI) and complex algorithms. While advanced, these systems can contain errors or inaccuracies and are for educational purposes only.
- Technical analysis provides no guarantees; this information is purely informative.
- All discussed scenarios are hypothetical and do not constitute predictions or expectations.
- Past performance is not an indicator of future results.
- This is not financial advice and is not intended as a call-to-action for the reader.
- No implicit direction is claimed, and no specific behavior of market participants is suggested.