KPI: OID & FOP index (Derivatives Intelligence)
Derivatives Market Intelligence: OID & FOP Analysis
While price action indicates where the market is moving, the Derivatives Suite—consisting of OID (Open Interest Delta) and FOP (Funding-OI-Price)—is designed to analyze why it is moving. These KPIs assess the futures and options markets to determine if price movement is supported by new capital allocation or driven by derivative liquidations.
By utilizing these metrics, analysts can identify market conditions associated with “Squeezes” or trend exhaustion.
1. OID (Open Interest Delta)
Open Interest Delta (OID) measures the net change in the total number of outstanding derivative contracts (futures) over a specific period. It is the primary metric for identifying Capital Flow.
🟢 Positive OID (Inflow)
- Technical State: The total number of open contracts is increasing.
- Interpretation:
- Price Rising + Positive OID: Technically interpreted as a strong trend supported by aggressive new long positioning.
- Price Falling + Positive OID: Technically interpreted as aggressive new short positioning.
🔴 Negative OID (Outflow)
- Technical State: The total number of open contracts is decreasing.
- Interpretation: This typically occurs during liquidations or profit-taking phases.
- Price Rising + Negative OID: Often viewed as a “Short Covering” rally (shorts closing positions), rather than organic demand. Market theory suggests these moves may be less sustainable.
2. FOP (Funding-OI-Price)
The FOP is a confluence KPI that monitors the relationship between Funding Rates, Open Interest, and Price Action. Its purpose is to assess the leverage balance in the market.
Short Squeeze Scenario
- Data Setup: Negative funding rates (shorts paying longs) combined with rising Price and rising OI.
- Interpretation: This structure suggests the market is heavily positioned short while price moves against them, creating a setup often associated with Short Squeezes.
Long Exhaustion Scenario
- Data Setup: High positive funding rates (longs paying shorts) combined with stalling Price.
- Interpretation: This suggests the market is “crowded” with longs who are paying a premium to hold positions, increasing the risk of a “Long Flush” (liquidation cascade) if price fails to advance.
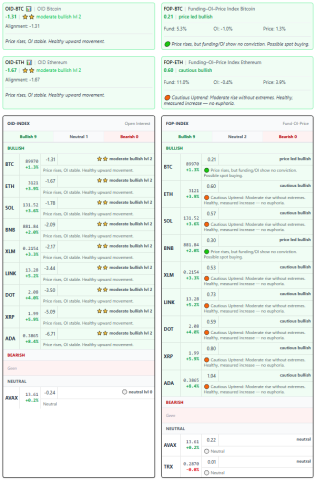
3. OID-INDEX & FOP-INDEX: Multi-Coin Aggregation
The Indices are normalized, high-level versions of the raw data. Unlike standard OID/FOP which tracks single assets, the INDEX versions provide a “Market Heatmap” by aggregating data from top-volume assets simultaneously.
Sentiment Grouping
To provide a view of market breadth, the assets within the indices are algorithmically categorized:
- 🟢 Bullish Group: Assets displaying rising prices supported by new capital inflow (Positive OID) and stable funding.
- ⚪ Neutral Group: Assets in consolidation or displaying conflicting data signals.
- 🔴 Bearish Group: Assets under pressure—characterized by falling prices, aggressive shorting, or extreme leverage imbalance.
Analytical Utility
- OID-INDEX: Measures the “Velocity” of capital across the market. A high OID-Index with the majority of coins in the Bullish Group suggests a broad-based rally.
- FOP-INDEX: Functions as a leverage gauge. An extremely high FOP-Index combined with a growing Bearish Group is monitored as a warning sign of potential market-wide deleveraging.
4. Market Scenarios: Interpreting the Data
| Price Action | OID Status | FOP Status | Technical Interpretation |
| Price Up | 🟢 Positive | 🟢 Healthy | Trend Strength: New capital is entering to support the move. |
| Price Up | 🔴 Negative | 🟠 Elevated | Short Covering: Rally driven by position closing; potential for exhaustion. |
| Price Down | 🟢 Positive | 🔴 High Risk | Aggressive Shorting: New shorts are entering the market aggressively. |
| Price Down | 🔴 Negative | 🟢 Resetting | Long Liquidation: Leverage is being flushed out; market resetting OI. |
5. Integration with MMS V2
The OID and FOP Indices serve as logic gates for the MMS (Market Macro Score) algorithm.
- Trend Confirmation: The MMS logic prioritizes “Growth” strategies only if the OID-INDEX confirms that capital is flowing into the Bullish Group, validating the price action.
- Risk Management: Even if price structure appears bullish, a high-risk FOP-INDEX (indicating extreme leverage) is designed to trigger a REDUCE_EXPOSURE status. This logic aims to filter out setups prone to volatility flushes.
⚠️ RISK WARNING & AI DISCLOSURE
- This information is generated by Artificial Intelligence (AI) and complex algorithms. While advanced, these systems can contain errors or inaccuracies and are for educational purposes only.
- Technical analysis provides no guarantees; this information is purely informative.
- All discussed scenarios are hypothetical and do not constitute predictions or expectations.
- Past performance is not an indicator of future results.
- This is not financial advice and is not intended as a call-to-action for the reader.
- No implicit direction is claimed, and no specific behavior of market participants is suggested.