KPI: MQS (Market Quality Score)
Analyzing Market Structure: The Market Quality Score (MQS)
The Market Quality Score (MQS) is a specialized KPI designed to evaluate the internal composition of a price movement. Rather than analyzing price action in isolation, the MQS analyzes the source of liquidity—specifically distinguishing between Spot (asset accumulation) and Perpetual/Futures (leveraged positioning) volume.
This analysis assists traders in determining whether a trend is driven by organic demand or if it relies heavily on speculative leverage.
1. Core Score (Scale: 0 – 100)
The MQS provides a numerical rating from 0 to 100 based on the confluence of underlying data points.
- High Score (e.g., 80/100): Indicates a “Spot-Driven” move. Technical analysis generally views trends supported by aggressive spot buying as having a stronger structural foundation.
- Low Score (e.g., 40/100): Indicates a “Leverage-Driven” or “Divergent” move. This suggests that price action is primarily supported by derivatives volume while spot demand may be weak or selling.
2. Key Indicators & Breakdown
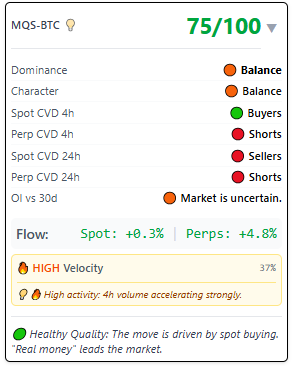
The MQS dashboard provides a granular view of the data points driving the final score:
Dominance & Character
- Dominance (🟠 Balanced/🟢 Strong): Reflects which side of the order book (Bid vs. Ask) currently exerts statistical control over the flow.
- Character (🟠 Balanced/🟢 Bullish): Describes the profile of the current volume (e.g., accumulation vs. distribution).
CVD Analysis (Cumulative Volume Delta) The MQS monitors the buying/selling pressure for two timeframes (4h and 24h) across distinct market segments:
- Spot CVD (🟢 Buyers / 🔴 Sellers): Tracks the volume in the Spot market. Green indicates net buying of the actual asset, often interpreted as long-term positioning.
- Perp CVD (🟢 Longs / 🔴 Shorts): Tracks the volume in the Perpetual Futures market. Green indicates net long leverage, while red indicates net short leverage. This metric represents speculative interest.
OI vs 30d (Open Interest Velocity) This compares current Open Interest to the 30-day average.
- 🟢 Extreme Inflow: Signals a significant surge of capital entering the derivatives market relative to the monthly average. In technical analysis, rapid OI expansion is often monitored as a precursor to increased volatility.
Flow Breakdown
- Spot Flow %: The percentage contribution of spot volume to the current price move.
- Perp Flow %: The percentage contribution of leveraged volume.
- Market Theory: A rally where Spot Flow significantly exceeds Perp Flow is often technically interpreted as having higher “quality” due to the lack of liquidation risk associated with spot holdings.
3. Signal Interpretations
The MQS algorithm outputs a textual interpretation based on the confluence of the data:
- 🟢 Healthy Quality (Spot Backed): The move is driven by spot buying. This structure suggests that asset accumulation is the primary driver of price.
- 🟠 Moderate Quality: Spot and Futures volumes are relatively balanced. The trend structure shows no distinct bias towards accumulation or speculation.
- 🟠 Speculative: Price is driven primarily by Futures leverage. Technical analysts view this as a higher-risk structure due to the potential for “long squeezes” or liquidations.
- 🔴 Low Quality (Divergent): A divergence signal where Spot participants are selling while Futures participants are buying (or vice versa). This market structure is often monitored for potential reversals or “traps.”
- ⚪️ Unclear / Neutral: Volume analysis shows no clear conviction. The market is likely in a consolidation or sideways phase.
4. Analytical Utility of MQS
Standard technical analysis often focuses on price, but MQS focuses on participation.
- Leverage-Driven Moves: Price appreciation driven solely by Perpetuals carries the risk of “Liquidation Cascades,” as leveraged traders may be forced to close positions during volatility.
- Spot-Driven Moves: Price appreciation driven by Spot represents asset ownership. Spot holders are not subject to liquidation prices, creating a technically more robust support structure (a “price floor”).
5. Automated Triggers
The MQS data feeds directly into the system’s global alert engine to provide real-time notifications on structural shifts.
⚠️ RISK WARNING & AI DISCLOSURE
- This information is generated by Artificial Intelligence (AI) and complex algorithms. While advanced, these systems can contain errors or inaccuracies and are for educational purposes only.
- Technical analysis provides no guarantees; this information is purely informative.
- All discussed scenarios are hypothetical and do not constitute predictions or expectations.
- Past performance is not an indicator of future results.
- This is not financial advice and is not intended as a call-to-action for the reader.
- No implicit direction is claimed, and no specific behavior of market participants is suggested.