KPI: ETF Dashboard
Institutional Flow Analysis: The ETF Dashboard
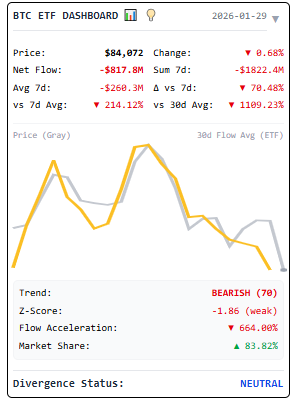
The ETF Dashboard is a Key Performance Indicator designed to aggregate institutional data. It functions as an analytical bridge, processing capital flow data to visualize the movement of institutional funds in real-time.
In the current market structure, institutional flows are a significant variable in price discovery. This dashboard allows users to monitor these movements for Bitcoin (BTC), Ethereum (ETH), and Solana (SOL).
1. Tracked Assets
The algorithm monitors net capital flows for the following instruments:
- BTC ETF: Aggregated data from major US Spot Bitcoin ETFs (e.g., IBIT, FBTC, GBTC).
- ETH ETF: Real-time tracking of the Ethereum Spot ETF ecosystem.
- SOL ETF: Monitoring emerging institutional products and ETPs (Exchange Traded Products) related to Solana.
2. Key Metrics & Terminology
Net Daily Flow (e.g., +$150.4M / -$42.1M)
- 🟢 Green (Inflow): Indicates positive net capital allocation. In market theory, sustained inflows are often interpreted as demand-driven support, potentially creating technical support levels.
- 🔴 Red (Outflow): Indicates net capital redemption. Large, sustained outflows are historically associated with distribution phases or capital rotation.
Flow Intensity The algorithm analyzes the velocity of capital movement. A “Massive Inflow” status is triggered when daily net buying exceeds calculated standard deviation thresholds, indicating significant institutional participation.
3. Visual Momentum: The Mini Trend Charts
Integrated into the dashboard is a Mini Trend Chart (Sparkline) for each asset.
- Trend Identification: The mini chart displays the net flow history over a rolling period (typically 7–30 days). This assists users in determining if a daily data point is an isolated event or part of a sustained Accumulation Trend.
- Visualizing Outflows: A series of small red bars confirms a “bleed” pattern. In technical analysis, consistent low-volume outflows can sometimes be more indicative of sentiment shifts than a single large redemption.
- Volatility Analysis: A “jagged” mini chart suggests indecision, whereas a smooth, directional chart suggests consistent institutional conviction.
4. Divergence Analysis: Price vs. Flow
The ETF Dashboard helps identify market divergences:
- Bullish Convergence: When the price of an asset is rising and ETF flows are Positive, the trend is considered “High Quality” as it is supported by verified capital injection.
- Bearish Divergence: If the price is rising while ETF flows are Negative, it indicates a divergence. This suggests that while price is increasing, institutional vehicles are net sellers. This data is fed into the MMS Distribution logic as a potential risk factor.
5. Integration with MMS V2
The data from the ETF Dashboard serves as a primary input for the Market Macro Score (MMS) engine.
- Institutional Support: Strong ETF inflows are designed to increase the MMS internal confidence score.
- Sentiment Shift: Rapid outflows decrease the MMS score, allowing the algorithm to adjust strategies based on institutional weakness before it fully materializes in price action.
6. Interpreting the Data
- Consistency vs. Outliers: Analysts often use the Mini Chart to verify trend consistency. A single day of outflow is statistically less significant than a multi-day downward trend.
- Volume Significance: Significant volume events (e.g., an inflow exceeding $500M+ in a single day for Bitcoin) are monitored as outliers that historically correlate with increased volatility.
- Capital Rotation: Occasional outflows in BTC concurrent with inflows in ETH may suggest Sector Rotation, where institutions rebalance portfolios rather than exiting the asset class entirely.
⚠️ RISK WARNING & AI DISCLOSURE
- This information is generated by Artificial Intelligence (AI) and complex algorithms. While advanced, these systems can contain errors or inaccuracies and are for educational purposes only.
- Technical analysis provides no guarantees; this information is purely informative.
- All discussed scenarios are hypothetical and do not constitute predictions or expectations.
- Past performance is not an indicator of future results.
- This is not financial advice and is not intended as a call-to-action for the reader.
- No implicit direction is claimed, and no specific behavior of market participants is suggested.