KPI: Total Market Analyzer
Macro-Analytical Engine: The Total Market Analyzer & MMS
The Total Market Analyzer represents the central hub of this analytical ecosystem. Unlike standard indicators that focus on isolated data points, this module aggregates global macro-economics, institutional flow data, and derivatives metrics in real-time.
By synthesizing these variables into a singular, actionable framework, the MMS (Market Macro Score) provides traders with a “Top-Down” perspective of market structure. It is designed to filter market noise and highlight significant trends in capital allocation.
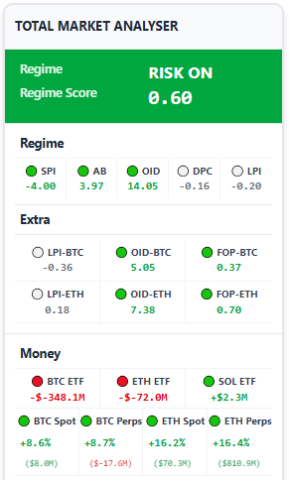
1. Regime Analysis
The Regime identifies the current sentiment environment of the financial markets, categorizing the statistical tendency of capital flow.
- Risk-On: Capital is statistically flowing out of defensive assets (like the US Dollar or Gold) and into growth assets like Equities and Crypto.
- Risk-Off: Capital is statistically flowing out of volatile assets and into defensive positions (USDT, Cash, or Gold).
Methodology: The system analyzes the correlation between traditional markets (S&P 500, DXY) and crypto performance. If both asset classes rise while stablecoin dominance falls, the regime is algorithmically confirmed as Risk-On.
2. Regime Score
The Regime Score is a quantitative representation of market conviction.
Scale (-1.00 to +1.00)
- +1.00 (High Risk-On): Indicates aggressive capital allocation across growth sectors.
- 0.00 (Neutral): Indicates an indecisive or sideways market with no clear trend bias.
- -1.00 (High Risk-Off): Indicates aggressive capital flight to safety.
Methodology: The score is a weighted average of momentum indicators, macro-economic volatility (VIX), and capital flow intensity. It quantifies the magnitude of the market’s directional bias.
3. Regime Indicators (The Core Metrics)
These five indicators provide a granular view of market health:
- SPI (Stablecoin Pressure Index): Measures the flow of capital from stablecoins into crypto. A positive SPI indicates “Buying Pressure” (conversion to assets).
- AB (Alt Breadth): Measures the participation of the broader altcoin market. High breadth suggests a rally supported by the majority of assets, whereas low breadth suggests narrow, potentially fragile leadership.
- OID (Open Interest Delta): Tracks the net change in open futures contracts. This metric assists in distinguishing between “New Capital” entry and “Short Covering.”
- DPC (Dominance Price Correlation): Analyzes the relationship between Bitcoin’s dominance and its price to identify if BTC is leading the market or if capital is rotating.
- LPI (Leverage Pressure Index): Estimates the concentration of leverage. A high LPI suggests the market is “top-heavy,” a condition historically associated with increased liquidation risk.
4. Asset Specific Metrics
To provide granular detail, the system monitors specific indicators for BTC and ETH:
- LPI-BTC / LPI-ETH: Leverage pressure specifically for Bitcoin and Ethereum futures.
- OID-BTC / OID-ETH: Open Interest changes for individual assets to detect localized speculative heat.
- FOP-BTC / FOP-ETH (Funding-OI-Price): A confluence index combining Funding Rates and Open Interest to identify potential squeeze setups.
5. Money Flow Analysis
This section tracks the movement of significant capital volumes:
- ETFs (BTC, ETH, SOL): Real-time tracking of institutional net flows.
- Utility: Divergences, such as rising price during sustained ETF outflows, are monitored as potential “Distribution” signals.
- Spot vs. Perps (BTC & ETH):
- Spot Volume: Represents asset accumulation (often viewed as higher quality demand).
- Perps Volume: Represents speculative leverage (often viewed as lower quality demand).
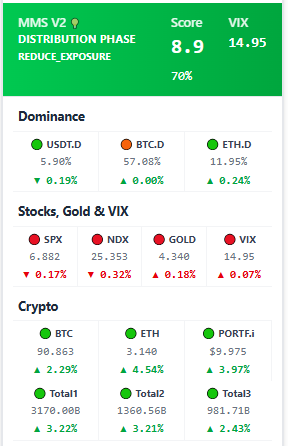
6. MMS – Market Macro Score (The Decision Engine)
The final output of the analytical engine is the Market Macro Score.
- Score: A weighted numerical value typically ranging from 0.0 to 10.0.
- Dynamic Range: During periods of extreme market confluence—where multiple high-impact signals align—the score can exceed 10.0 or drop below 0.0. This “uncapped” behavior reflects exceptional trend intensity.
- Pattern: The detected market phase (e.g., Distribution, Accumulation, Risk-On Rally).
- Interpretation: A text-based summary of what the current data implies for market structure.
7. Market Context: Dominance & Macro
- Dominance (USDT.D, BTC.D, ETH.D): Tracks the percentage of total market cap held by specific assets. Rising USDT dominance is technically inverse to crypto asset prices.
- Macro Benchmarks:
- SPX / NDX: Performance of the S&P 500 and Nasdaq.
- GOLD: Performance of traditional “Safe Haven” assets.
- VIX: The Volatility Index. A rising VIX indicates increasing macro-economic uncertainty.
8. Crypto Totals
- BTC / ETH / PORTF.i: Performance tracking for major assets and the indexed portfolio.
- Total1: Total Crypto Market Cap.
- Total2: Total Market Cap excluding BTC.
- Total3: Total Market Cap excluding BTC and ETH (The “Altcoin” Index).
9. Sync State
The Sync status determines the correlation between Crypto and Traditional Finance (TradFi):
- Coupled: Crypto markets are moving in statistical lockstep with the S&P 500/Nasdaq.
- Decoupled: Crypto markets are exhibiting an independent trajectory, distinct from traditional equities.
- Neutral: No significant statistical correlation is detected.
10. Interpretation & Triggers
- Interpretation: A synthesized summary (e.g., “Price is rising, but ETF flows indicate distribution; monitor for potential divergence”).
- Triggers: Automated system alerts activated by specific data thresholds (e.g., massive_etf_outflow, perp_speculation_warning).
Technical Note: The KPI Indicators Dashboard is updated automatically in real-time via websocket connections. Manual page refreshes are not required and may interrupt the data stream.
⚠️ RISK WARNING & AI DISCLOSURE
- This information is generated by Artificial Intelligence (AI) and complex algorithms. While advanced, these systems can contain errors or inaccuracies and are for educational purposes only.
- Technical analysis provides no guarantees; this information is purely informative.
- All discussed scenarios are hypothetical and do not constitute predictions or expectations.
- Past performance is not an indicator of future results.
- This is not financial advice and is not intended as a call-to-action for the reader.
- No implicit direction is claimed, and no specific behavior of market participants is suggested.