
The cryptocurrency market has experienced significant volatility leading up to February 8, 2026. In this Bitcoin Price Analysis, we dissect the current market structure for BTCUSDT using both high-timeframe (1-day) and lower-timeframe (4-hour) charts. By combining standard Technical Analysis (TA) with advanced Orderflow data, we aim to provide a factual overview of the liquidity landscape, momentum shifts, and key support and resistance levels. Disclaimer: This article is for informational purposes only and does not constitute financial advice, investment recommendations, or an endorsement of any digital asset. Digital assets are highly volatile and risky.
The Macro View: Daily Chart Capitulation
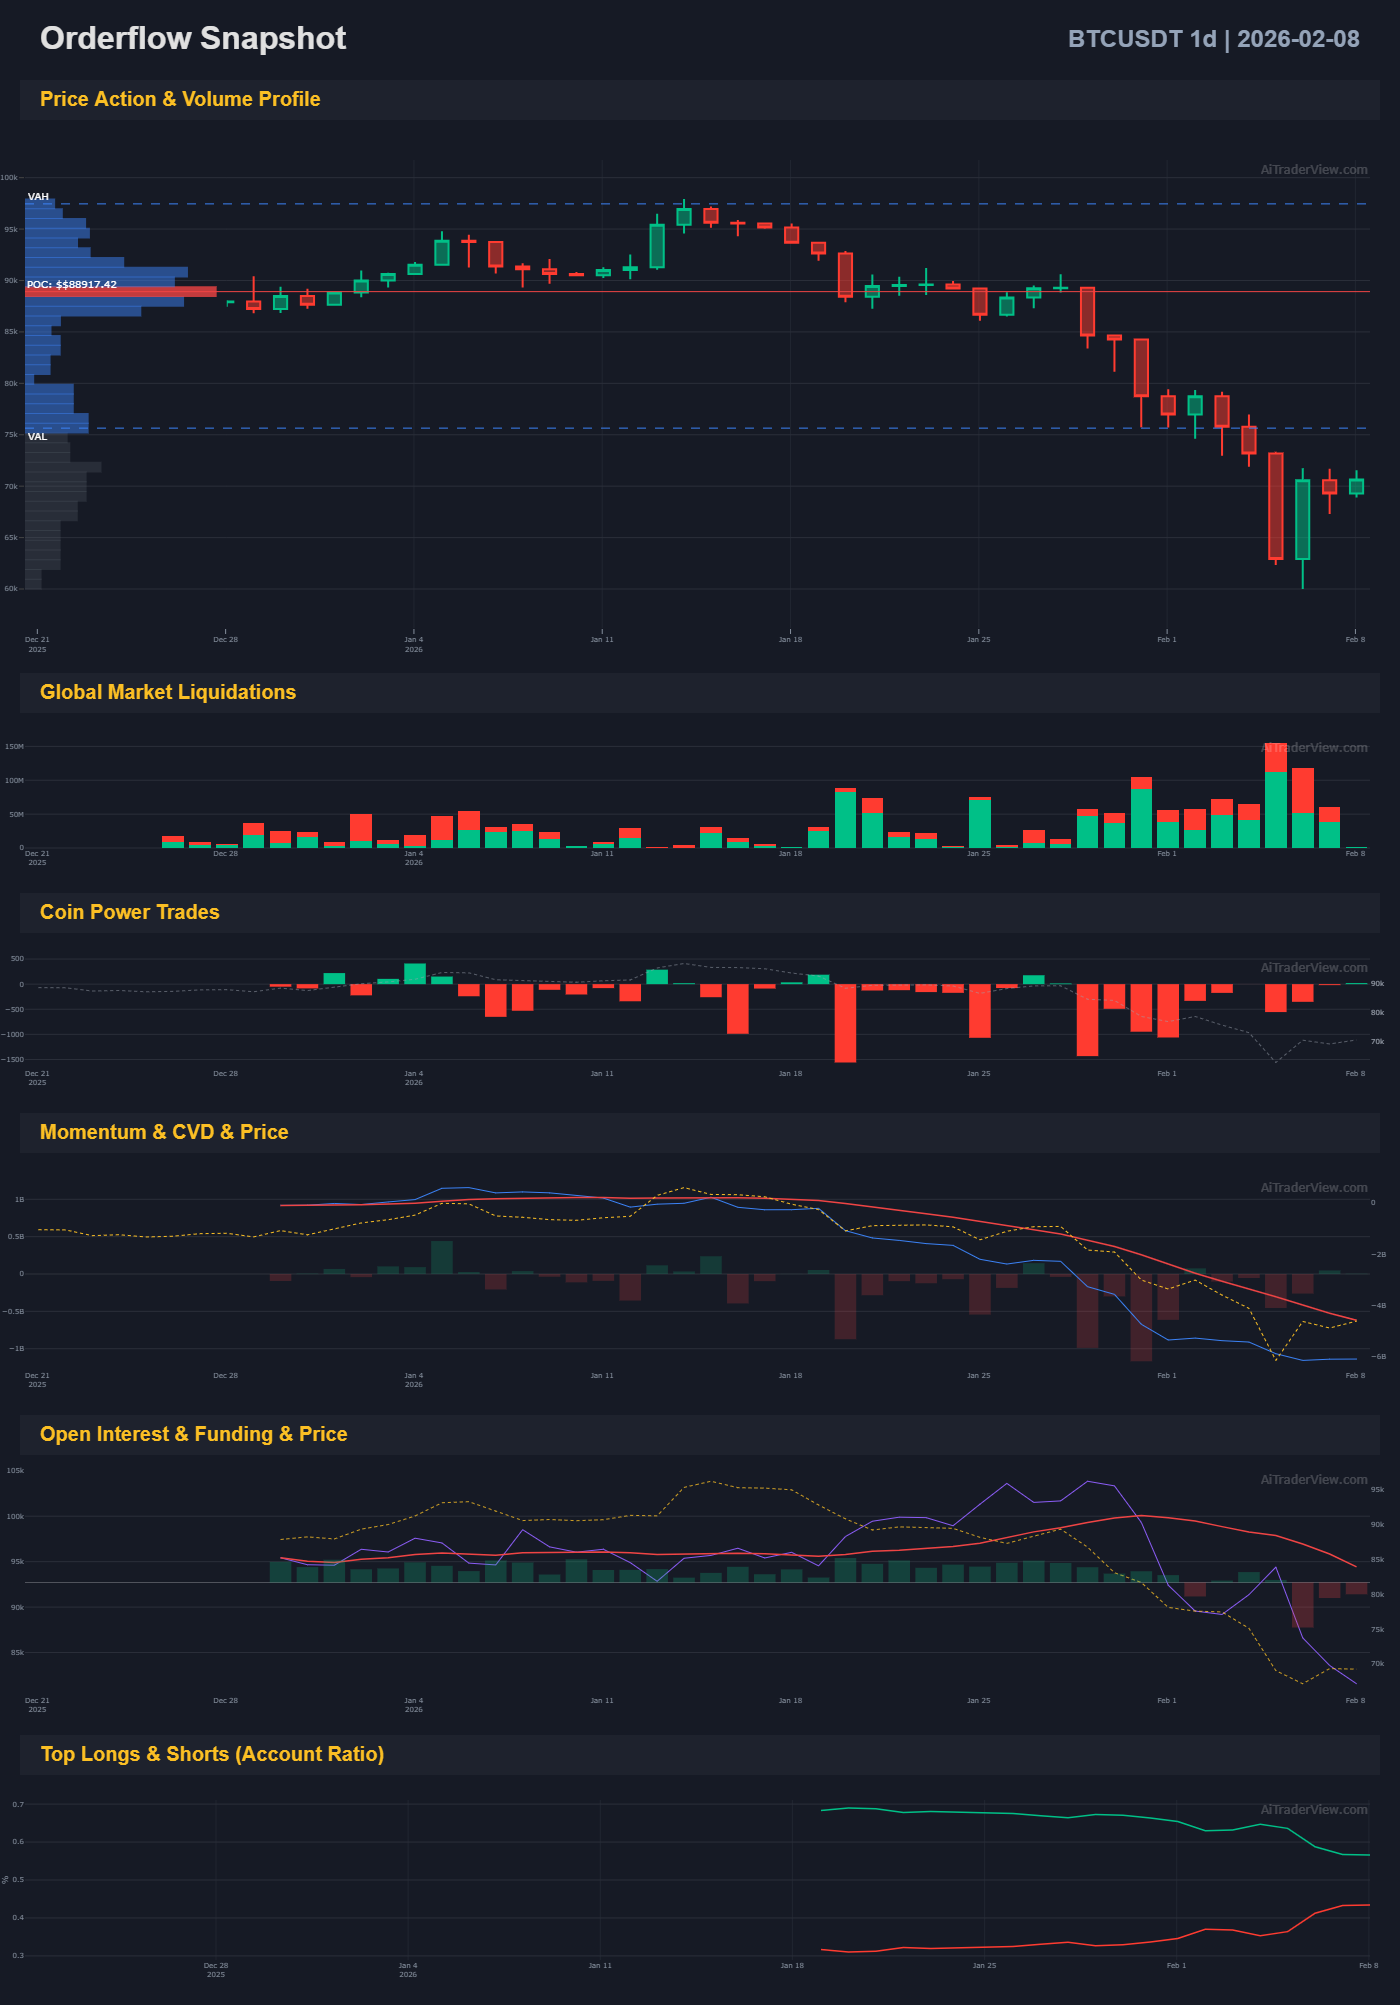
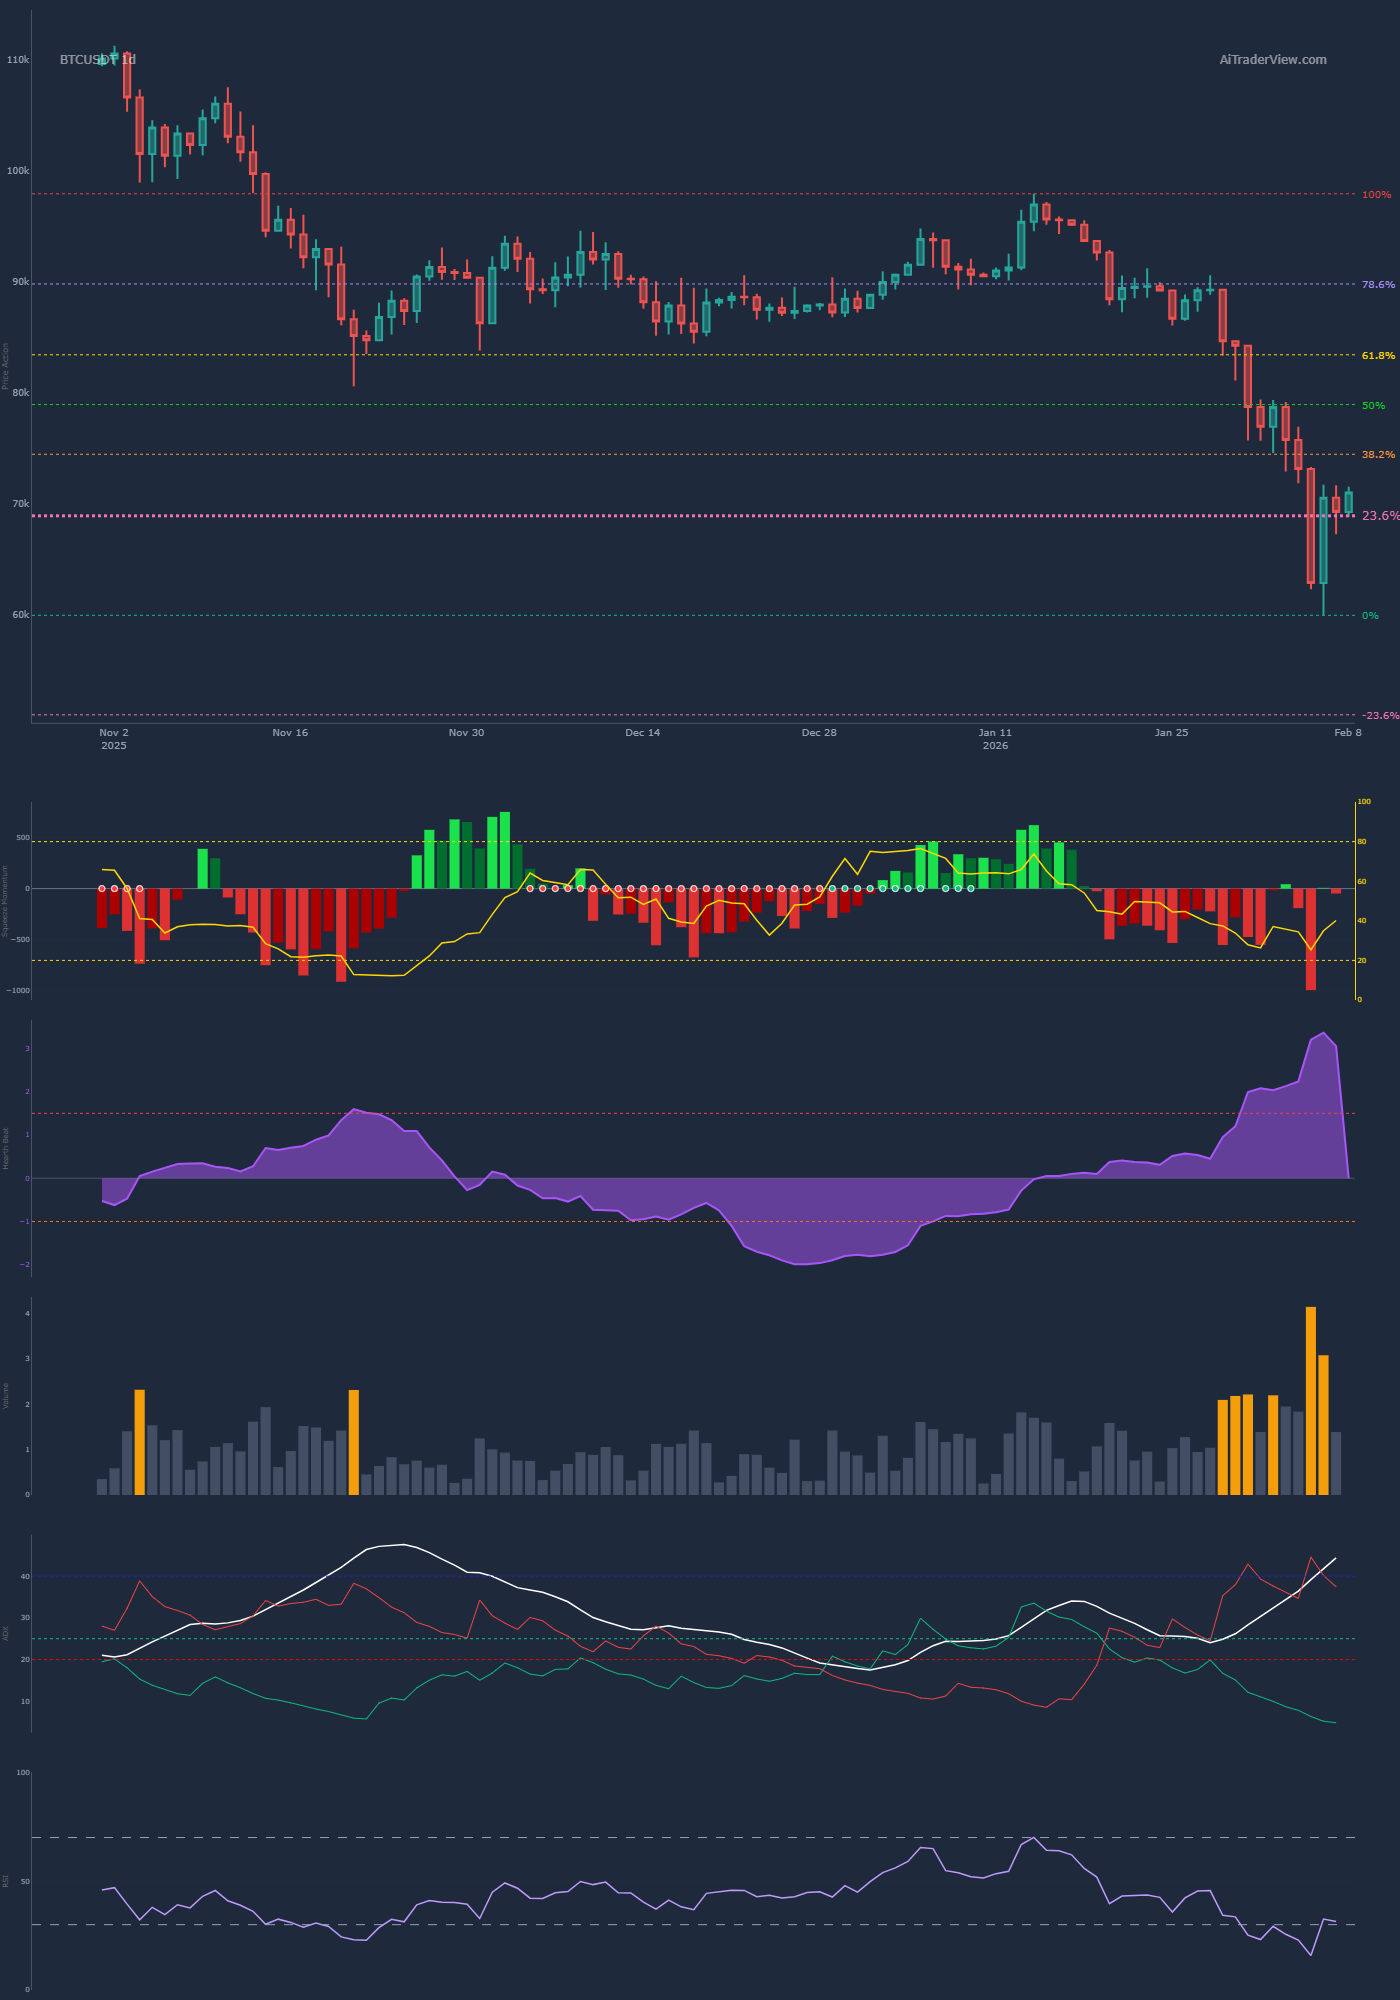
When observing the daily (1d) chart, the dominant trend is undeniably bearish. The market has undergone a severe correction, breaking through multiple historical support structures. A critical component of this Bitcoin Price Analysis is the Point of Control (POC), visible on the Volume Profile. The POC currently sits around the $93,222 level, which now acts as a formidable overhead resistance “wall.” Orderflow data reveals that this downward move was fueled by a “long liquidation cascade.” The Global Market Liquidations indicator shows dominant red bars, signifying that traders positioning for a price increase were forced to close their positions, adding sell pressure to the market.
Trend Strength and Momentum
Technical indicators confirm the intensity of this trend. The Average Directional Index (ADX)—represented by the white line in the lower panels—is spiking sharply. An ADX rising above key thresholds typically indicates a strengthening trend. In this case, the negative directional index (-DI) is towering over the positive index (+DI), confirming that sellers maintain macro control. Furthermore, the volume bars have turned a bright “capitulation” color (often yellow/orange in specific trading scripts). This suggests the market may be experiencing a climax in selling pressure. While the Relative Strength Index (RSI) and Wave Trend indicators are deep in “oversold” territory, this alone does not guarantee an immediate V-shape reversal, but rather suggests the elastic band of the market is stretched to its limit.
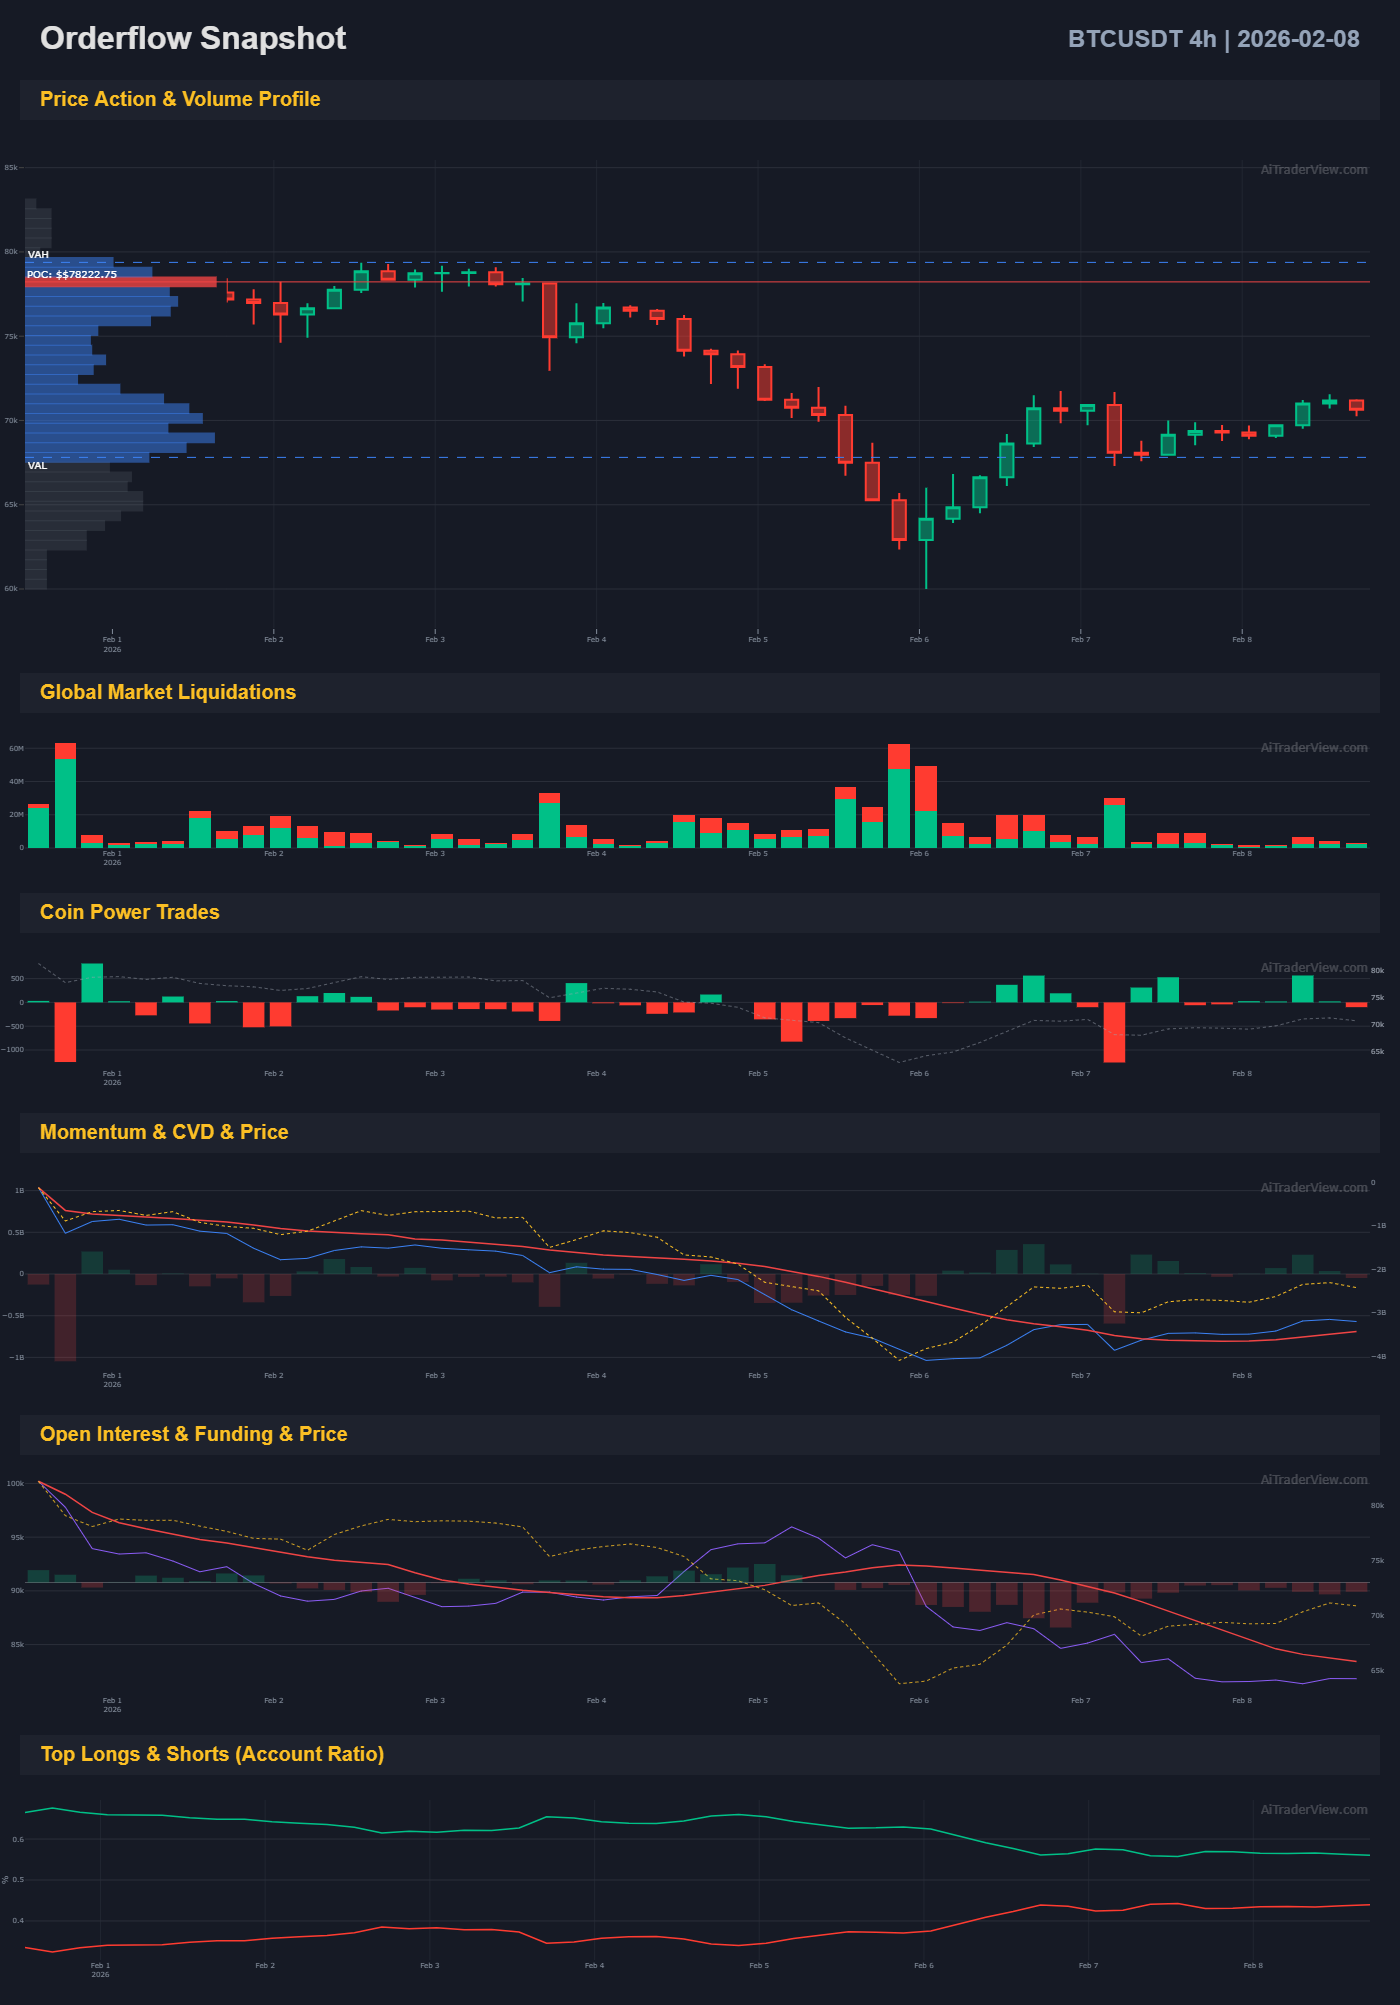
Short-Term Outlook: The 4-Hour Relief Bounce
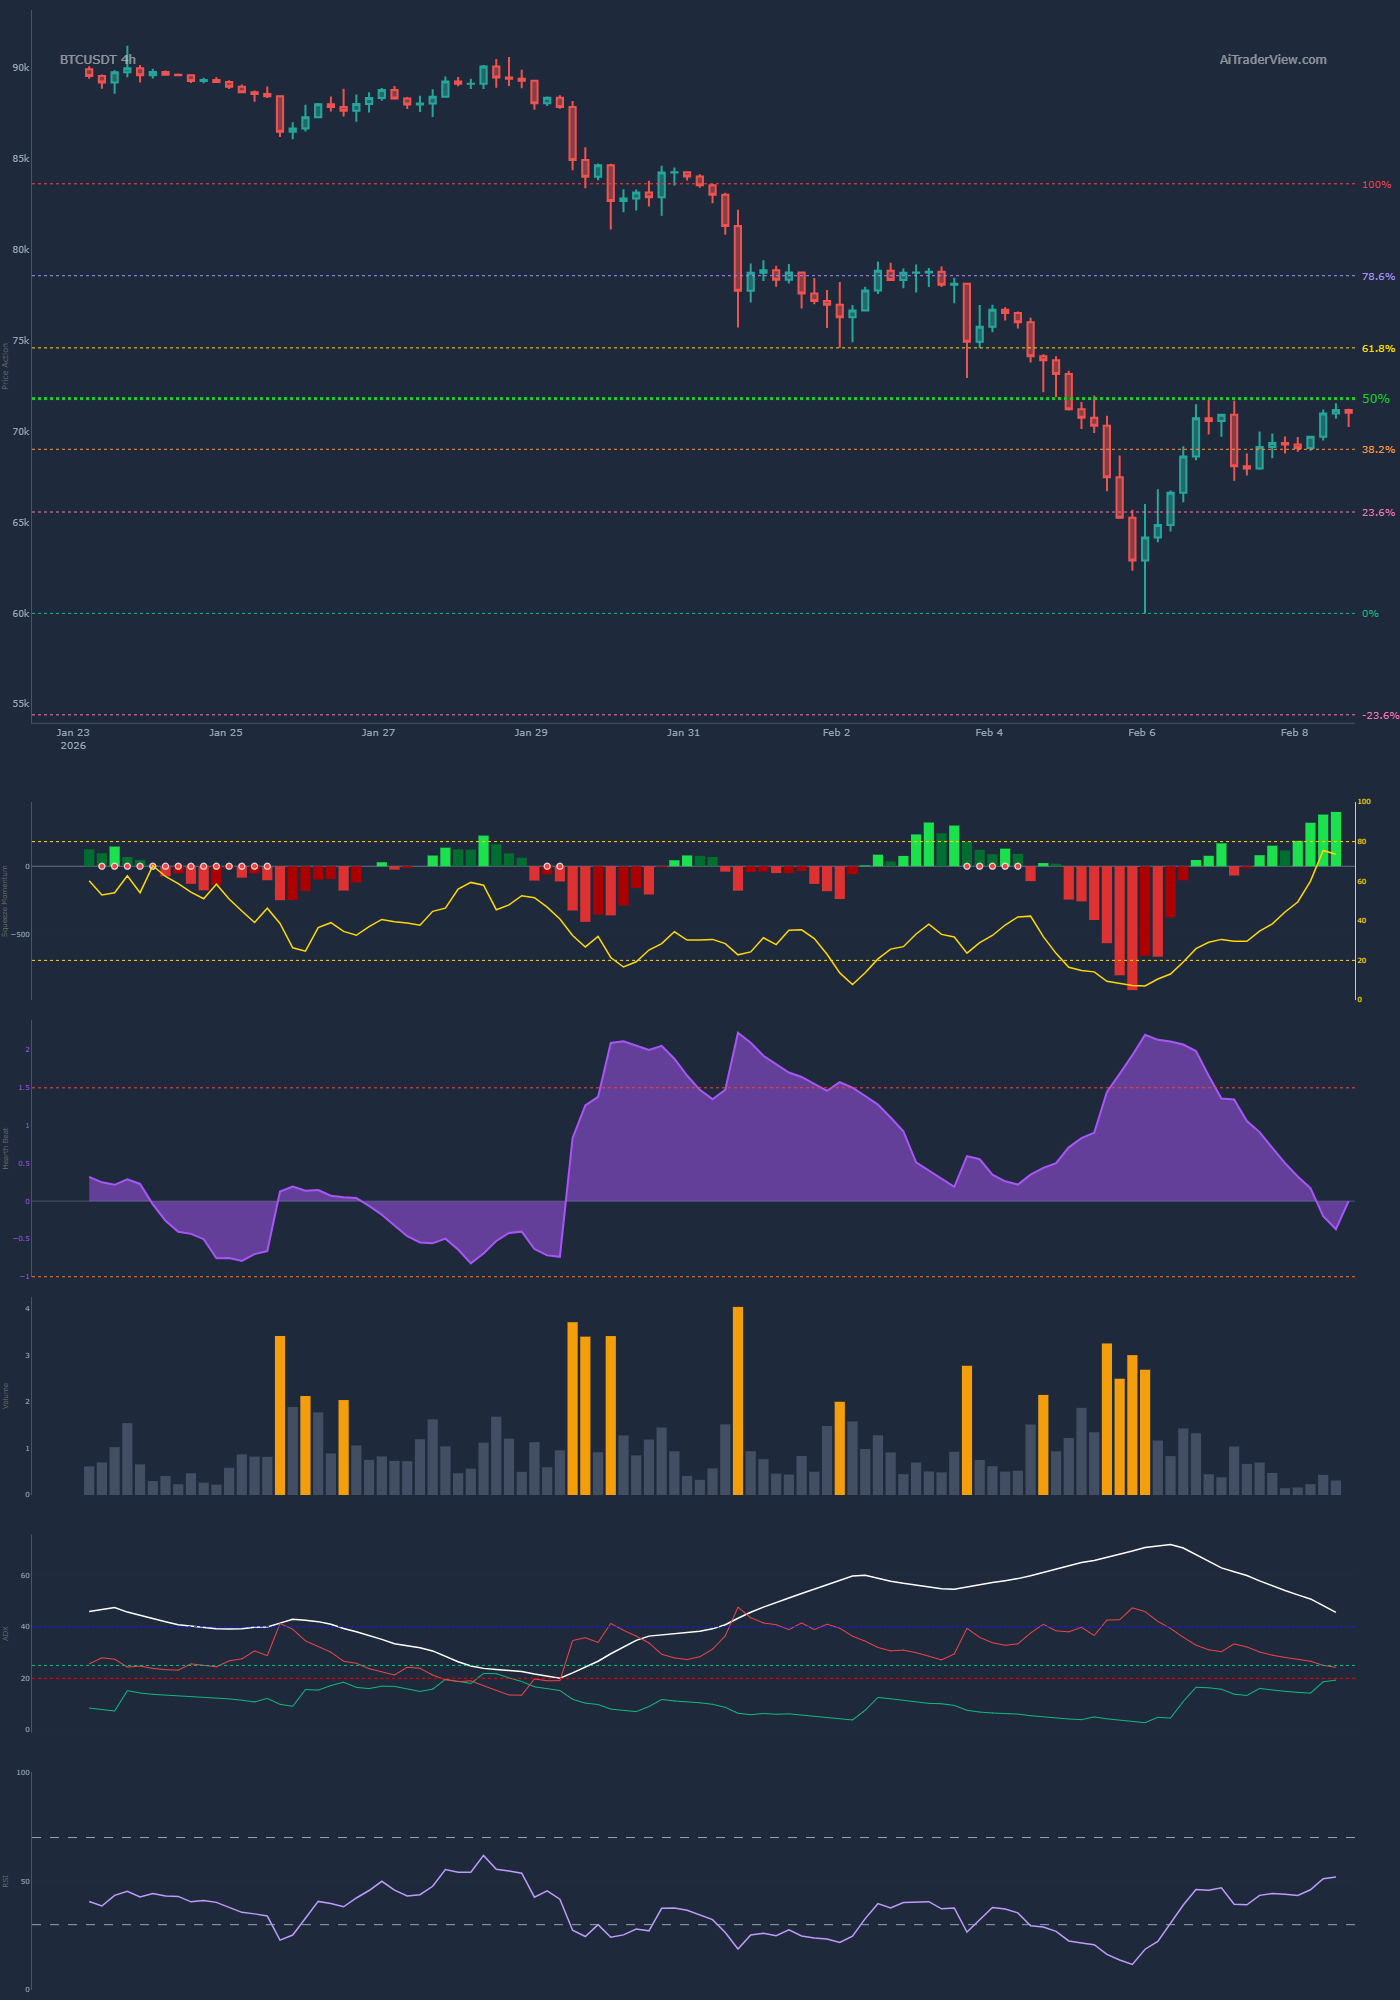
While the daily chart paints a grim picture, a granular Bitcoin Price Analysis on the 4-hour (4h) timeframe reveals a developing counter-trend. The market is currently in the midst of a “relief bounce,” driven by a different set of market dynamics than the macro trend.
Signs of Short Squeezing
Contrasting with the daily chart, the 4-hour liquidations panel shows the emergence of green bars. This indicates “Short Liquidations.” Late sellers who entered the market at the bottom are now being squeezed out as the price ticks upward, providing the fuel for the current price appreciation. Additionally, the “Coin Power Trades” metric has shifted from red to green/cyan, suggesting that net buying volume has temporarily overtaken selling pressure on this timeframe. This is a classic characteristic of an oversold bounce where the market seeks equilibrium after a violent move down.
Technical Confluence and Key Levels
Integrating the technical indicators with orderflow gives us a clearer picture of the current range. The 4-hour Momentum Squeeze indicator has flipped from red to green, and the Wave Trend oscillator displays a bullish crossover (Golden Cross) emerging from the oversold zone. These are technical signals often associated with short-term price recovery.
Fibonacci Retracement Targets
However, caution is advised. As part of a prudent Bitcoin Price Analysis, one must look at where this bounce might face exhaustion. The Fibonacci retracement tool drawn on the charts highlights the 38.2% and 50% levels as significant zones of interest. These levels often act as resistance during a bearish retest. Unless the price can reclaim these levels with significant volume and sustained buying pressure, the current upward movement technically remains a correction within a larger downtrend. The Cumulative Volume Delta (CVD) has flattened, which supports the idea of a pause in selling, but has not yet shown the aggressive divergence needed for a full trend reversal.
Conclusion
In summary, this Bitcoin Price Analysis highlights a bifurcated market. The macro timeframe (1d) remains structurally damaged with heavy overhead resistance at the $93,000 POC and strong bearish momentum. Conversely, the micro timeframe (4h) is providing a technical relief rally driven by short liquidations and oversold conditions. Market participants observing these charts will likely be monitoring the Fibonacci resistance levels closely to see if the bearish trend resumes or if the 4-hour momentum is sufficient to challenge the macro structure. As always, risk management remains paramount in such volatile conditions.
⚠️ RISK WARNING & AI DISCLOSURE
- This information is generated by Artificial Intelligence (AI) and complex algorithms. While advanced, these systems can contain errors or inaccuracies and are for educational purposes only.
- Technical analysis provides no guarantees; this information is purely informative.
- All discussed scenarios are hypothetical and do not constitute predictions or expectations.
- Past performance is not an indicator of future results.
- This is not financial advice and is not intended as a call-to-action for the reader.
- No implicit direction is claimed, and no specific behavior of market participants is suggested.