
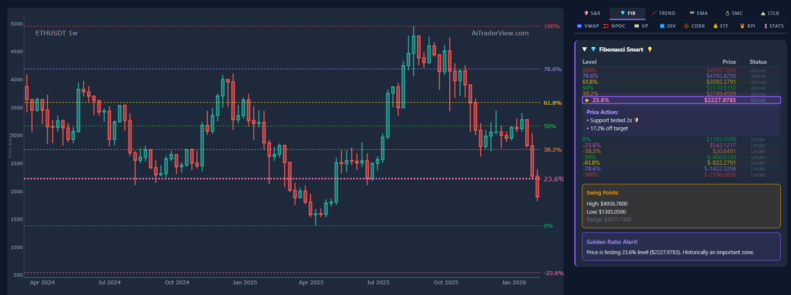
Ethereum drops 63% from ATH based on current market data, reflecting a deep and extended correction within a broader risk-off environment. ETH is trading around 1,840 USD, placing the asset far below its historical peak and confirming sustained downside pressure across both short-term and higher timeframes.
Ethereum drops 63% from ATH in a risk-off macro regime
Market sentiment indicators classify the current environment as risk-off. Capital is rotating away from cryptocurrencies, supported by rising stablecoin dominance and weakening Bitcoin and Ethereum dominance metrics. This shift indicates reduced risk appetite and a preference for defensive positioning among market participants.
Broader financial market data reinforces this context. Equity indices are trending lower, while volatility indicators show a sharp increase. At the same time, aggregate crypto market capitalization metrics report double-digit percentage declines across major segments. These conditions underline the strong correlation between digital assets and global risk sentiment.
Technical structure and trend confirmation
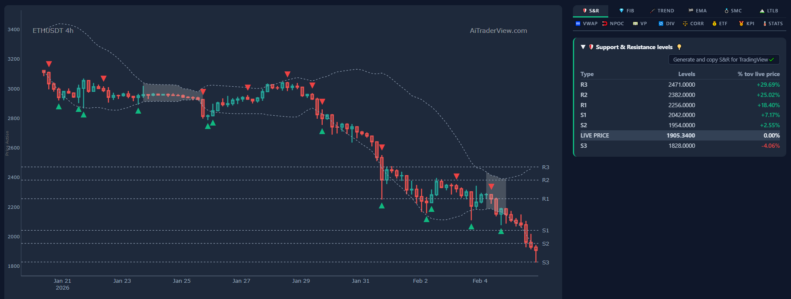
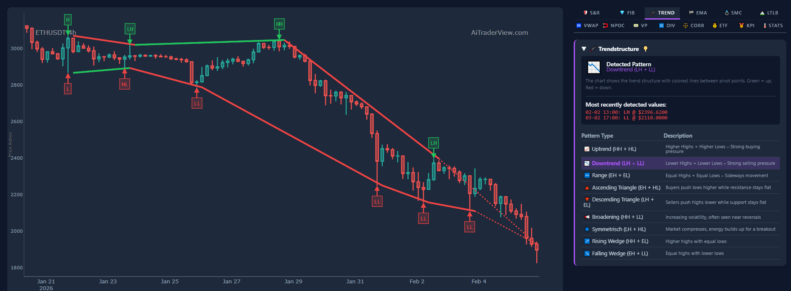
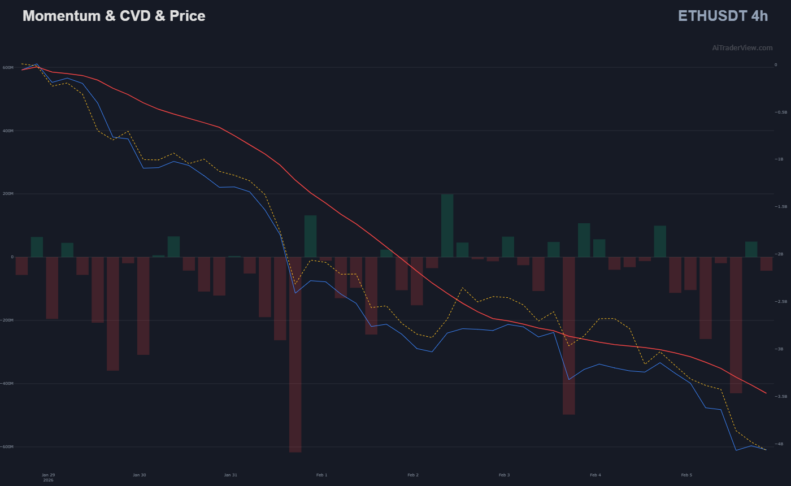
Ethereum remains firmly positioned in a bearish market structure. On the four-hour timeframe, price action continues to form lower highs and lower lows, confirming a persistent downtrend. ETH trades significantly below all key exponential moving averages, including the 200-period EMA, highlighting the strength of the prevailing bearish bias.
Daily timeframe indicators align with this assessment. Trend-following tools such as Supertrend and moving average structures remain negative, while momentum indicators continue to point lower. Although oscillators such as RSI, Stochastic, and MFI are deeply oversold, no confirmed trend reversal or volatility compression signal has emerged.
Volume, leverage, and order flow dynamics
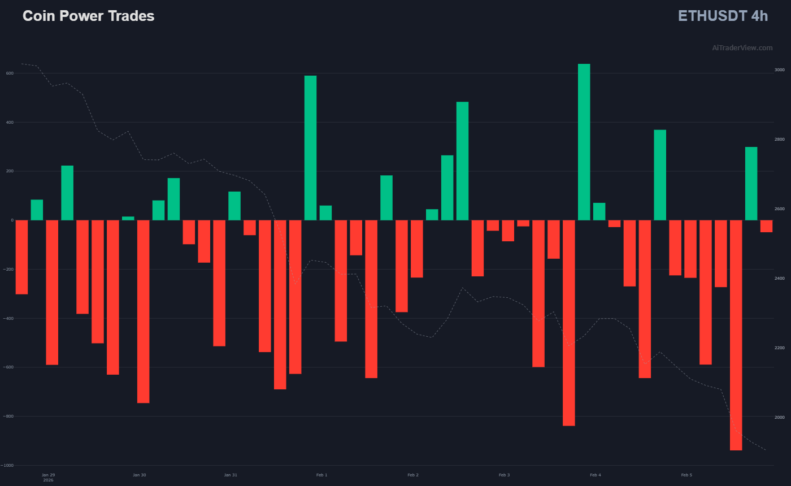
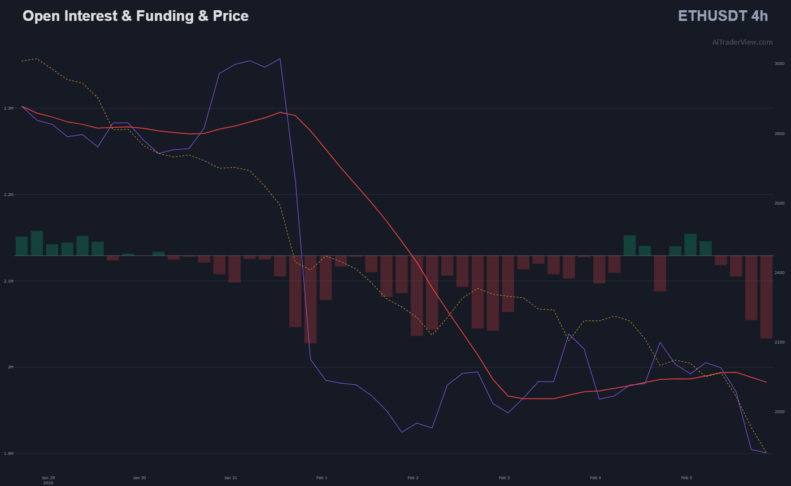
Order flow data shows ongoing selling dominance. Cumulative volume delta remains strongly negative, indicating that aggressive sell orders outweigh buying activity. The buy-to-sell ratio remains slightly skewed toward sellers, while declining open interest suggests that leveraged positions are being reduced rather than rebuilt.
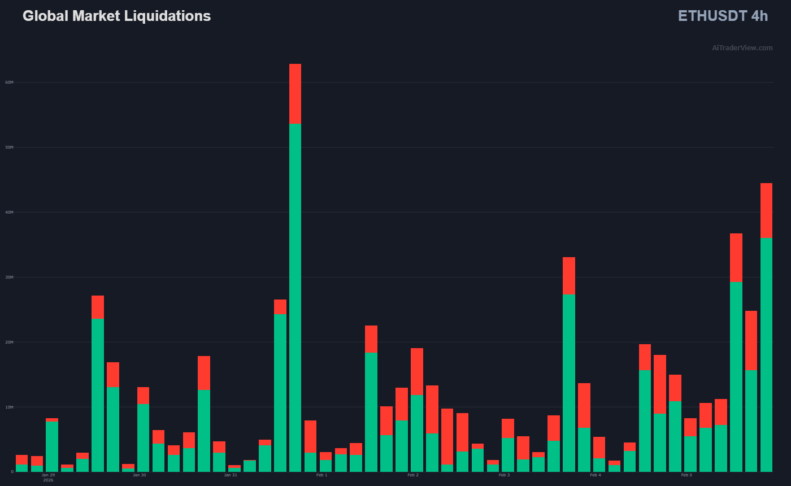
Funding rates remain near neutral to mildly negative, reflecting cautious derivatives positioning and a lack of directional conviction. Repeated liquidation events, primarily affecting long positions, have accompanied recent volatility spikes. These liquidations illustrate the stress present in the market and the fragility of current positioning.
ETF flows and institutional behavior
Ethereum ETF flow data shows notable variability with a clear bias toward net outflows in recent sessions. Several trading days record substantial withdrawals, indicating reduced institutional exposure during the ongoing drawdown. While intermittent inflows have occurred, they have not altered the broader negative flow trend.
These patterns align with declining crypto equity performance and confirm that Ethereum remains closely linked to broader risk conditions rather than isolated asset-specific factors. Institutional participation appears reactive to macroeconomic and volatility-driven signals.
Support, resistance, and volatility conditions
Key technical levels define the current trading environment. Support is located near the lower 1,800 USD region, while resistance levels remain significantly higher, clustered above the 2,000 USD area and extending toward previous value zones. Volatility remains elevated, as reflected by expanding Bollinger Band width and rising average true range metrics.
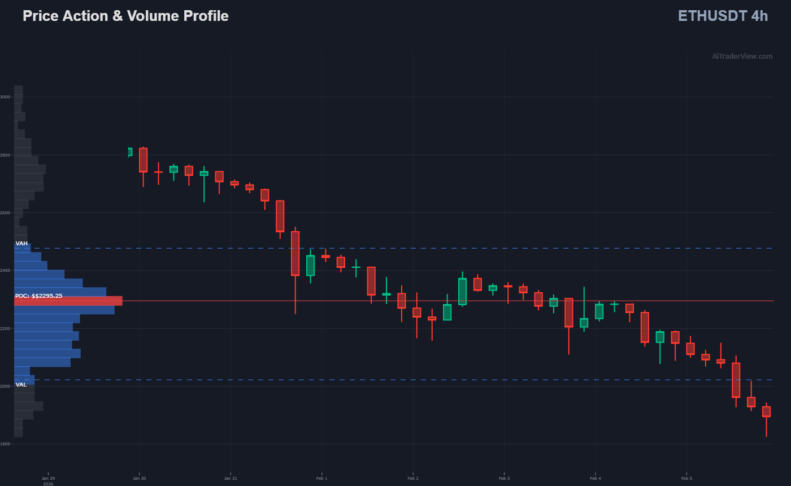
Volume profile data shows limited high-volume acceptance near current price levels, suggesting cautious participation rather than sustained accumulation. No volatility squeeze conditions have been identified, reinforcing the absence of confirmed market stabilization.
Broader market implications
Ethereum drops 63% from ATH in a market characterized by defensive positioning, rising stablecoin dominance, declining leverage, and persistent negative order flow. The combination of ETF outflows, elevated volatility, and bearish technical alignment points to a phase of consolidation under pressure rather than directional recovery.
For additional context on the volatility measures referenced in this analysis, information on the VIX index is available from the Chicago Board Options Exchange at Cboe VIX.
All observations in this article are derived exclusively from the provided market data and describe current conditions without forecasting future price movements or offering investment guidance.
⚠️ RISK WARNING & AI DISCLOSURE
- This information is generated by Artificial Intelligence (AI) and complex algorithms. While advanced, these systems can contain errors or inaccuracies and are for educational purposes only.
- Technical analysis provides no guarantees; this information is purely informative.
- All discussed scenarios are hypothetical and do not constitute predictions or expectations.
- Past performance is not an indicator of future results.
- This is not financial advice and is not intended as a call-to-action for the reader.
- No implicit direction is claimed, and no specific behavior of market participants is suggested.