
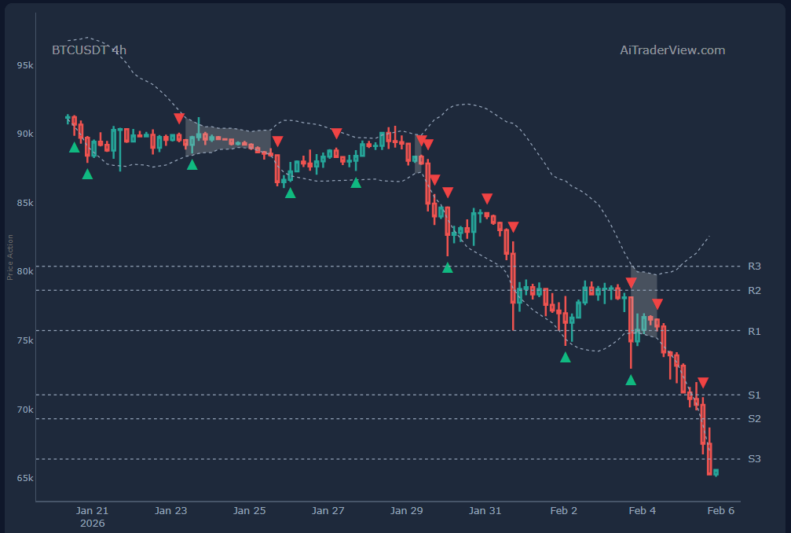
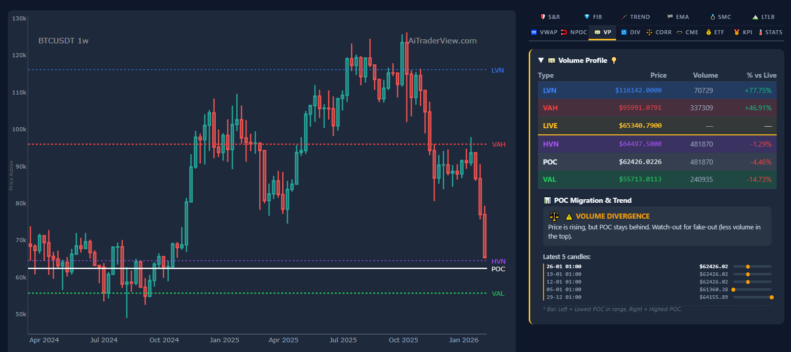
The Bitcoin price crash has become the central focus of the financial markets this week, with the leading cryptocurrency suffering a severe contraction. Bitcoin (BTC) is currently trading around $65,440, effectively cutting its value nearly in half from its recent peak. The asset has recorded a precipitous decline of approximately 22% in just the last seven days. This movement is not merely a period of consolidation; it represents a sharp correction that is actively clearing short-term positions and placing immense pressure on the mining sector.
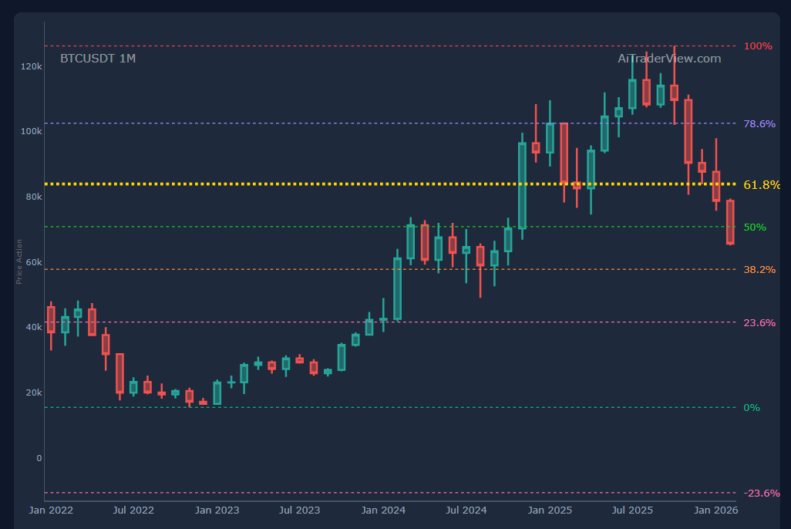
From a macro perspective, the current Bitcoin price crash places the asset 48.10% below its all-time high of $126,160, which was reached on October 6, 2025. The market is witnessing two simultaneous narratives: a violent short-term weekly drop of 22% and a medium-term trend that has failed to recover toward the October highs. A decline of this magnitude within a single week typically indicates a rapid reduction in risk exposure, characterized by margin calls, stop-loss cascades, and the unwinding of leveraged positions. While painful, these mechanics often serve to “cleanse” the market of excess speculation.
Market Sentiment During the Bitcoin Price Crash
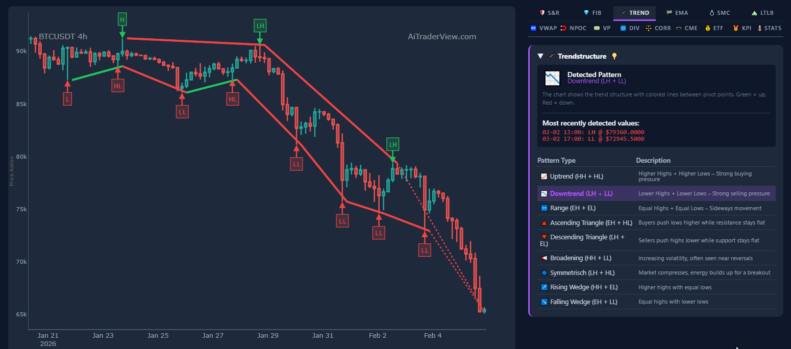
A weekly decline of 22% fundamentally alters market behavior. During a Bitcoin price crash, the feedback loop between falling prices and increased selling pressure intensifies. Buyers step back to wait for stability, while sellers rush to limit losses. Consequently, the market sentiment shifts from seeking growth to ensuring survival. Traders pay less attention to long-term narratives and focus intensely on liquidity, spreads, and historical support levels.
Crucially, data indicates this is not a sideways accumulation phase where energy is built for the next leg up. Instead, it is a structural break in confidence that must resolve before stabilization can occur. The sheer scale of the drop—erasing tens of thousands of dollars per unit—marks a significant reset point for the asset class.
On-Chain Metrics and Miner Distress
Despite the volatility in price, the transactional layer of the Bitcoin network remains remarkably calm. The memory pool (mempool) is holding a modest 12,035 transactions, with minimum fee rates at 1 sat/vB and median fees around 4 sat/vB. This suggests that the Bitcoin price crash is not being driven by on-chain panic selling or network congestion, but likely by activity on centralized exchanges and derivatives markets.
However, the mining sector is showing clear signs of stress. While the 90-day hashrate remains strong at 1,024.9 EH/s, the actual block production time has slipped to 11 minutes and 31 seconds, well above the 10-minute target. This indicates that some miners are struggling to maintain operations.
- Projected Difficulty Adjustment: The market expects a significant downward adjustment of approximately -13.2%.
- Next Retarget Date: Expected around February 7, 2026.
- Revenue Squeeze: With the block subsidy at 3.125 BTC and fees averaging only 0.02 BTC, miners are heavily reliant on the BTC price. As the price falls, dollar-denominated revenue evaporates, squeezing miners with high operational costs.
Institutional Treasuries and Liquidity
Corporate adoption remains a structural pillar, though it has offered little immediate support during the current Bitcoin price crash. Public companies collectively hold approximately 2,285,604 BTC, representing roughly 11.44% of the total supply, with a value of $149.6 billion.
Key corporate holders include:
* MicroStrategy: 713,502 BTC
* MARA Holdings: 53,250 BTC
* Twenty One Capital: 43,514 BTC
* Metaplanet: 35,102 BTC
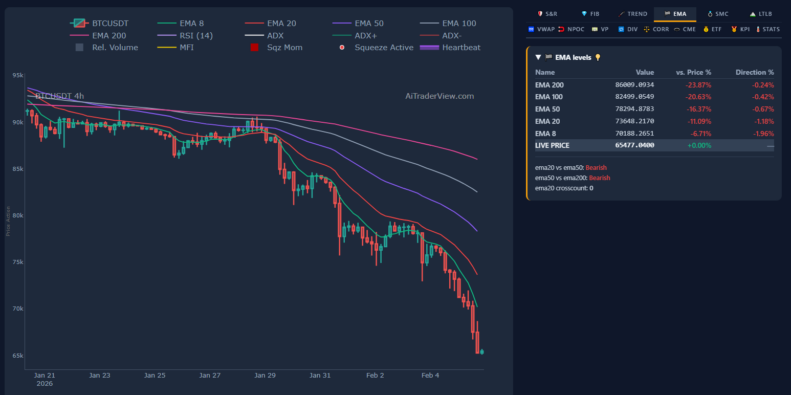
While these entities, particularly MicroStrategy, continue to acquire Bitcoin, their buying power has not been sufficient to counteract the immediate liquidity demands of a 22% weekly drop. In the short term, liquidity dynamics and leverage reduction override the long-term accumulation thesis of corporate treasuries. The market is currently looking for signs of stabilization, such as the exhaustion of selling pressure or a normalization of block times, to determine when the bottom of this correction has been reached.
⚠️ RISK WARNING & AI DISCLOSURE
- This information is generated by Artificial Intelligence (AI) and complex algorithms. While advanced, these systems can contain errors or inaccuracies and are for educational purposes only.
- Technical analysis provides no guarantees; this information is purely informative.
- All discussed scenarios are hypothetical and do not constitute predictions or expectations.
- Past performance is not an indicator of future results.
- This is not financial advice and is not intended as a call-to-action for the reader.
- No implicit direction is claimed, and no specific behavior of market participants is suggested.