
Solana price analysis indicates a notable shift in market structure as the asset faces sustained selling pressure, moving significantly away from established value areas. The beginning of February has been characterized by increased volatility and a breakdown in bullish sentiment, as evidenced by multiple technical indicators. Market participants are closely monitoring the reaction around the $100-$105 zone following a rejection from higher levels.
Solana Price Analysis Reveals Key Resistance at $117.56
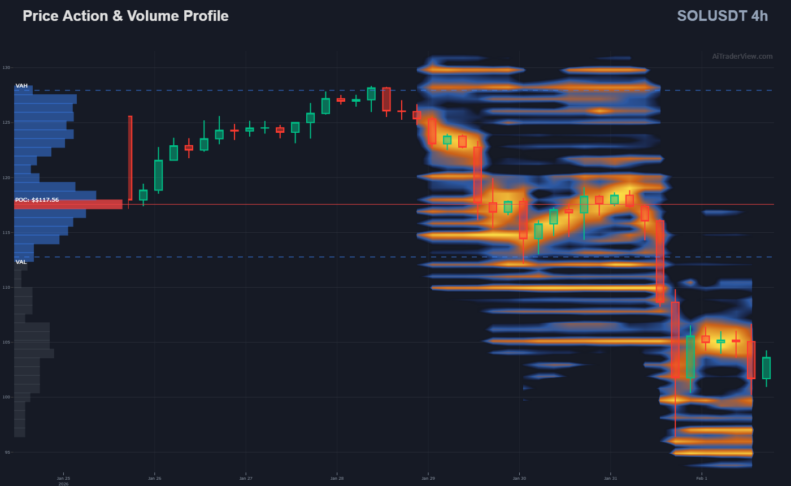
According to the Price Action & Volume Profile chart, Solana has drifted well below its Point of Control (POC), which is currently identified at $117.56. This level represents the price point with the highest traded volume over the observed period and now acts as a significant area of resistance. The chart displays a Value Area High (VAH) above the current price action, while the price has descended toward the Value Area Low (VAL). The inability of the asset to reclaim the POC suggests that sellers are currently in control of the immediate trend. The recent candles on the 4-hour chart show a sharp decline from the $128 region, stabilizing momentarily in the lower bounds of the visible range.
Liquidation Cascades and Open Interest Decline
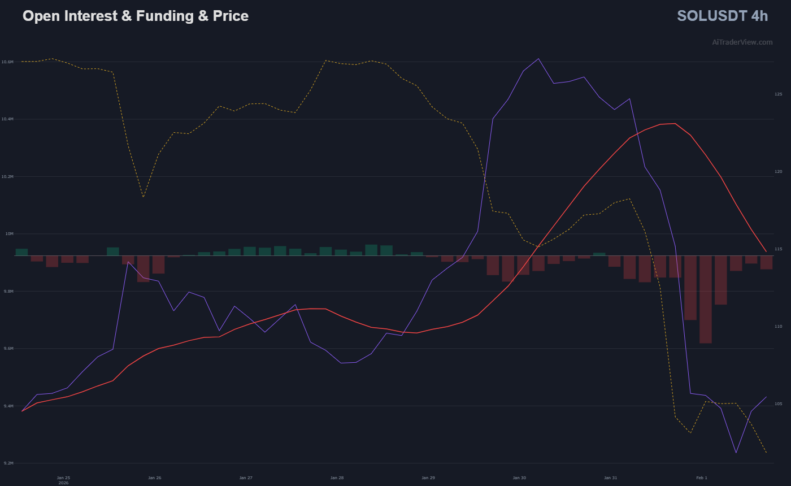
The correlation between price movement and derivatives data provides further context to the current Solana price analysis. The Open Interest & Funding & Price chart illustrates a significant contraction in Open Interest (OI), represented by the purple line. This metric peaked in late January but has since seen a sharp decline, coinciding with the downward price trajectory. A drop in OI during a price decrease often indicates that long positions are being liquidated or voluntarily closed, rather than new short positions driving the market alone.
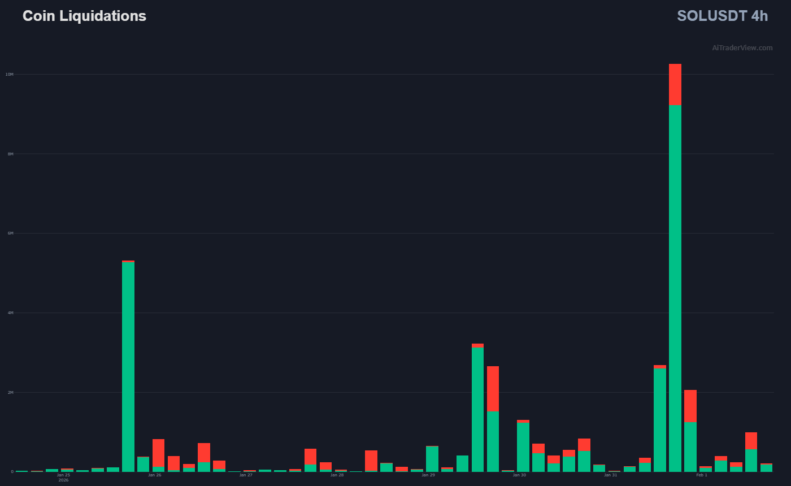
Supporting this view, the Coin Liquidations chart highlights a massive spike in long liquidations (green bars). The most recent data points show a substantial liquidation event, significantly larger than previous sessions. This “flush” of leverage confirms that the downward move triggered forced selling, exacerbating the price decline. Such liquidation cascades often precede periods of consolidation as the market seeks equilibrium after excess leverage is wiped out.
Momentum and Cumulative Volume Delta (CVD)
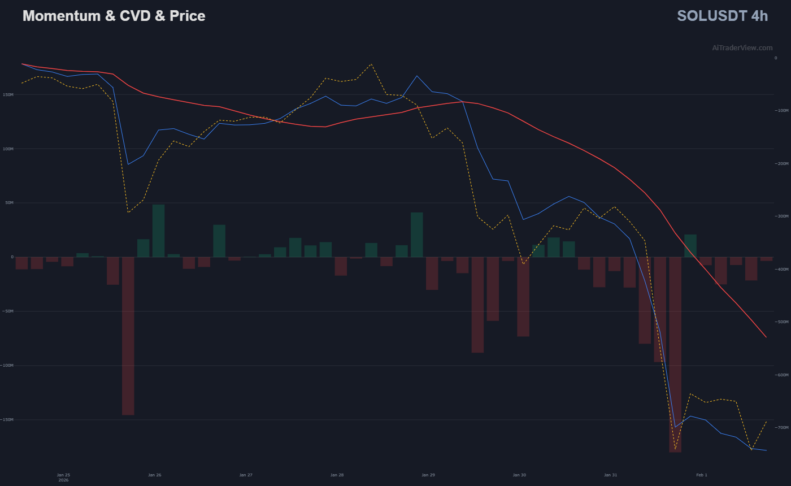
An examination of the Momentum & CVD & Price chart further reinforces the bearish outlook observed in this Solana price analysis. The Cumulative Volume Delta (CVD), depicted by the blue and yellow lines, has entered a steep downtrend, diving deep into negative territory. This divergence indicates aggressive market selling, where sell orders are consuming available liquidity on the order book. The trajectory of the CVD has not yet shown signs of flattening, suggesting that the selling momentum remains active.
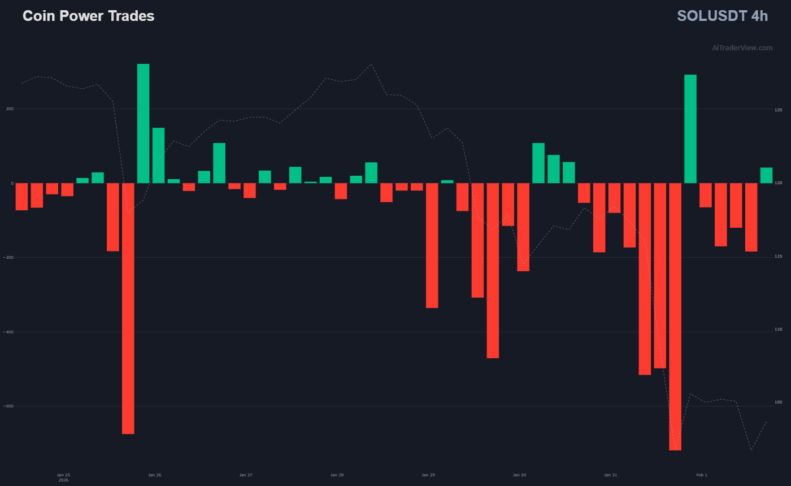
Furthermore, the Coin Power Trades chart displays dominant red bars, representing large sell orders executing in the market. While there are intermittent green spikes suggesting some absorption or “dip-buying” attempts, they have so far been insufficient to reverse the prevailing negative delta.
Long-Short Account Ratios Shift
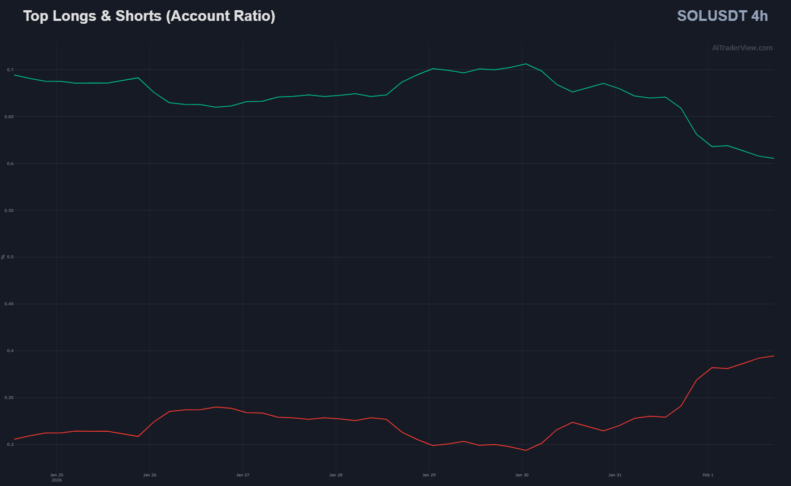
Sentiment among traders is also evolving. The Top Longs & Shorts (Account Ratio) chart shows a convergence between the percentage of long and short accounts. The green line, representing long positions, has declined from highs near 70% to approximately 60%, while the red line (shorts) has risen correspondingly. This shift in the account ratio suggests that retail sentiment is becoming less bullish, or that bullish traders are capitulating in the face of sustained downside pressure.
In conclusion, the technical data presents a cautious picture. With the price trading below the critical $117.56 POC and momentum indicators pointing downward, the market faces a test of support levels. Traders will likely look for a stabilization in CVD and Open Interest before considering any potential reversal in the trend.
⚠️ RISK WARNING & AI DISCLOSURE
- This information is generated by Artificial Intelligence (AI) and complex algorithms. While advanced, these systems can contain errors or inaccuracies and are for educational purposes only.
- Technical analysis provides no guarantees; this information is purely informative.
- All discussed scenarios are hypothetical and do not constitute predictions or expectations.
- Past performance is not an indicator of future results.
- This is not financial advice and is not intended as a call-to-action for the reader.
- No implicit direction is claimed, and no specific behavior of market participants is suggested.