
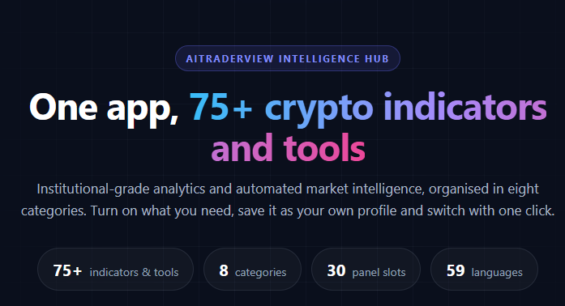
Op zoek naar gratis crypto-indicatoren op één plek? AiTraderView brengt nu meer dan 75 crypto-indicatoren en tools samen in één app, onderverdeeld in acht duidelijke categorieën. Zet aan wat je nodig hebt, sla het op als je eigen profiel en wissel met één klik van setup.
Eén app, 75+ crypto-indicatoren en tools
Analyses op institutioneel niveau en geautomatiseerde marktintelligentie, onderverdeeld in acht categorieën. Zet aan wat je nodig hebt, sla het op als je eigen profiel en wissel met één klik.
Price Action & Structuur
Automatisch grafieken lezen: niveaus, structuur en patronen worden voor je getekend.
- Auto Support & Resistance
- Auto Fibonacci (Golden Pocket)
- Auto Trendlines
- Trendstructuur (HH/HL/LH/LL)
- Swing High/Low-markeringen
- Laatste top / laatste bodem
- Supply & Demand-zones
- Japanse candlestickpatronen
- Divergenties
- Grafiekniveaus & zones
Smart Money & Volume
Zie waar instituties gepositioneerd zijn en waar het volume echt werd verhandeld.
- Smart Money Concepts (FVG, BoS, CHoCH)
- Premium / Discount-zones
- Volume Profile (VP)
- Volume Profile Advanced (VPad)
- Naked Point of Control (NPOC)
- Anchored VWAP
- Sessie-VWAP (dagelijks / wekelijks / maandelijks)
- Multi-timeframe VWAP
Trend & Momentum
Ken de richting, de kracht en weet wanneer het momentum gaat kantelen.
- EMA-trend (8/20/50/100/200)
- SMA-trend (8/20/50/100/200)
- SuperTrend
- MuroTrend
- RSI (14)
- MACD (12, 26, 9)
- ADX (14) met +DI / -DI
- Squeeze Check & Squeeze Momentum
- Trend Force & Fuel
- Trenduitputting
- Relatief volume
Orderflow & Liquiditeit
Een röntgenfoto van de markt: openstaande orders, liquidaties en echte handelsstromen.
- Orderbook-heatmap
- Liquidatieheatmap (Beta)
- Footprint 4u / 1D
- Imbalances & gestapelde imbalances
- Momentum, CVD & prijs
- Flow
- Liquidaties
- Handelsactiviteit (kopen vs verkopen)
- Grootste trade per candle
- Kracht: handelsstroom vs orderbook
Whales & Derivaten
Volg het grote geld en de hefboom achter elke beweging.
- PowerTrades
- Global PowerTrades
- Whale-deelname %
- Whales koop-/verkoopratio
- Retail koop-/verkoopratio
- Open Interest & Funding
- Top long- & shortposities
- Leverage Pressure Index (LPI)
- Long/Short Matrix (LSS)
- Derivatives Intelligence (OI/FOP)
Scanners & Mean Reversion
Scan alle coins tegelijk en spot overextended of squeezende markten.
- Crypto Screener
- Coin Scanner
- EMA & Mean Reversion
- RSI / Stoch / MFI & Mean Reversion
- ADX Scanner
- Squeeze Radar
- Crypto Heatmap
- Crypto RSI Heatmap
- Candlestickpatroon-scanner
Macro & Institutioneel
Het grotere plaatje: ETF’s, dominantie, aandelen en stablecoin-liquiditeit.
- ETF-stromen (BTC / ETH / SOL)
- Marktoverzicht (DXY, SPX, NDX, Gold, VIX)
- Dominantie (BTC.D, ETH.D, USDT.D)
- Total1 / Total2 / Total3
- Stablecoin Pressure Index (SPI)
- Crypto-aandelencorrelatie
- Dominantie-prijscorrelatie
- Alt Breadth
- Market Quality Score
- BTC-correlatie & catch-up lag
- CME Gap
AI & Risk Intelligence
AI-onderzoek en risicotools die je beslissingen objectief houden.
- AI Market Regime-score
- AI Final Ranking
- 72-uurs Bitcoin-outlook
- Dagelijkse AI-marktsamenvatting
- Bitcoin Anomaly Detector
- Smart Risk/Reward
- Checklist-signalen (Top / DCC / ES)
- Buy Checklist
- Geautomatiseerde alerts
Elke indicator draait op je eigen coins, live en gratis, in Crypto Cockpit, Crypto Portfolio en Crypto Screener. De app werkt in 59 talen (lees hoe dat werkt), en meer gratis opties vind je in onze Top 10 gratis tools voor cryptotraders. Maak je gratis AiTraderView-account aan om ze uit te proberen.
Disclaimer: Indicatoren en data zijn alleen bedoeld ter informatie en vormen geen financieel advies. Handelen in crypto brengt risico’s met zich mee.
⚠️ RISK WARNING & AI DISCLOSURE
- This information is generated by Artificial Intelligence (AI) and complex algorithms. While advanced, these systems can contain errors or inaccuracies and are for educational purposes only.
- Technical analysis provides no guarantees; this information is purely informative.
- All discussed scenarios are hypothetical and do not constitute predictions or expectations.
- Past performance is not an indicator of future results.
- This is not financial advice and is not intended as a call-to-action for the reader.
- No implicit direction is claimed, and no specific behavior of market participants is suggested.