
官方 YouTube 频道
学习 AiTraderView 一步一步来
下方是我们官方 YouTube 频道的视频 AiTraderView。它们讲解我们的加密货币分析软件如何运作,并帮助你 更有效地理解价格走势.
你还会找到教程、功能详解和实用见解,帮助你充分发挥我们工具的价值。
- 教程
- 功能详解
- 实用见解
- 交易策略
Crypto Cockpit您的完整交易台,集于一屏:实时图表、完整指标套件、您自己的价格水平和自动化市场情报,全部同步更新。 Crypto Screener在 1 小时、4 小时或 1 天周期上同时扫描所有关注的币种。几秒钟内看清一次走势是否有真实资金流支撑,然后一键在 Cockpit 中打开任意币种。 Crypto Portfolio实时仪表盘,按真实市场价格评估您的持仓。输入您的持有量和投入金额,平均价格、市值和盈亏会自动更新。 |
在找特定内容? 使用下方搜索栏,在完整视频库中快速查找视频、主题或交易策略。
Crypto Cockpit (Crypto Analysis Software)
Here is the full overview of all indicator options in the Crypto Cockpit Indicators Settings, across both sections.
Main Chart Indicators
Chart legend
Levels
Zones
Volume Profile (VP)
Volume Profile Advanced (VPad) — with POC, VAL, VAH, HVN, LVN individually toggleable
Trend Structure (HH/HL/LH/LL)
SMC (FVG + BoS/CHoCH) — with FVG, BoS, ChoCH, Premium/Discount Zone
Premium/Discount
Candlestick Patterns
Advanced Chart Patterns (not working yet)
Checklist Signals (Top/DCC/ES)
Squeeze Check — with Upperband, Midband, Lowerband
Orderbook Heatmap — with Peak filter
Footprint (4h/1D) — with Slim candles, Bid x Ask numbers, Imbalances, Stacked imbalances, POC, Multiple HVN, Value Area (70%), Delta per candle, Cumulative Delta, Unfinished auctions, Absorption, Exhaustion
EMA Trend (8/20/50/200) — EMA 8, 20, 50, 200 individually configurable (color + line width)
SMA Trend (8/20/50/200) — SMA 8, 20, 50, 200 individually configurable
Session VWAP (Daily/Weekly/Monthly) — individually configurable
Swing High/Low Marker
Auto Trendlines
Last Top/Bottom
BTC Correlation — with a stats table option
Divergences — RSI, MFI, MACD, Volume, OBV divergence
Panel Indicators
PowerTrades
Global PowerTrades
Whales Buy/Sell ratio
Momentum, CVD & price
Open interest, funding & price
Top Long & Shorts (account ratio)
Trading Activity (count buys & sells)
EMA & Mean reversion
RSI/Stoch & Mean reversion
RSI (14)
ADX (14)
Squeeze Momentum
Relative Volume
Retail Buy/Sell ratio
Whale Participation %
Biggest trade per candleShow More
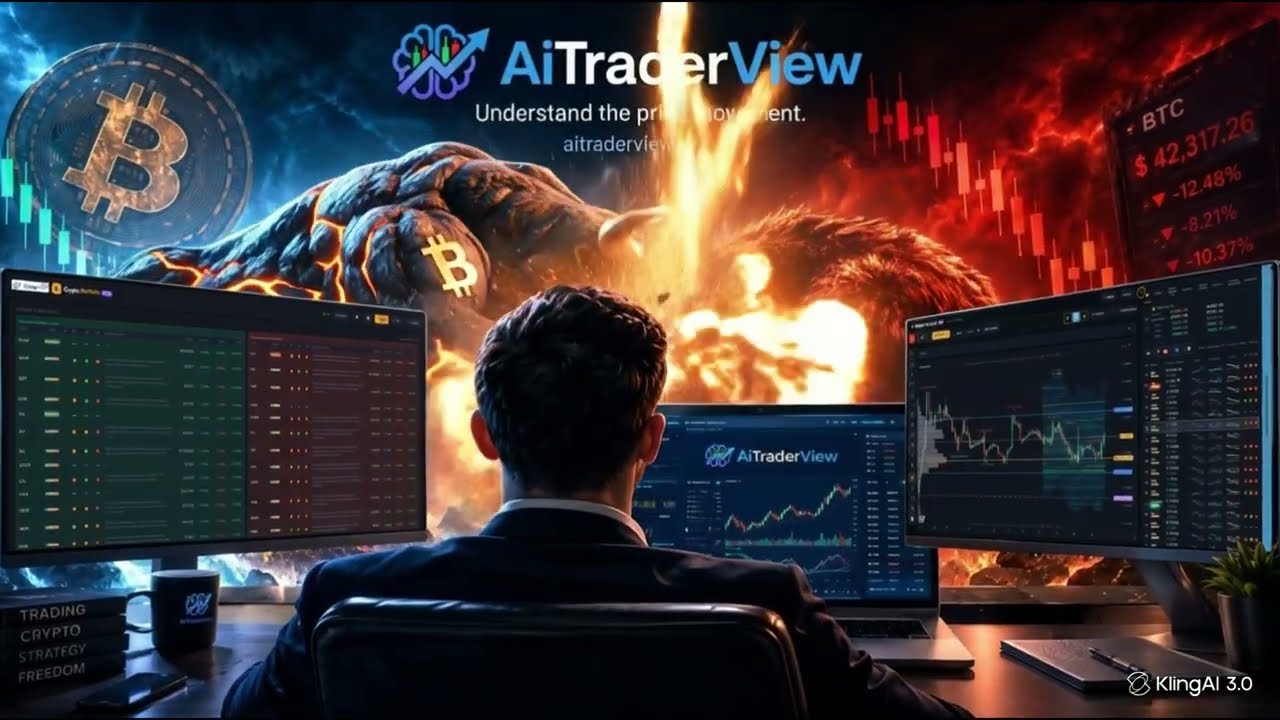
Crypto Cockpit (Crypto Analysis Software)
"Tired of jumping between ten different tools just to understand the ...

Crypto Portfolio (Crypto Analysis Software)
Tracking your crypto across spreadsheets and exchange apps? Crypto ...

EMA & SMA Trend Indicator Explained | AiTraderView Tutorial
Learn how to use the EMA & SMA Trend indicator on AiTraderView to read ...

BTC Correlation Indicator Explained | AiTraderView Tutorial
Learn how to use the BTC Correlation indicator on AiTraderView to see ...

Premium/Discount Indicator Explained | AiTraderView Tutorial
Learn how to use the Premium/Discount indicator on AiTraderView to ...
Session VWAP Indicator Explained | AiTraderView Tutorial
Learn how to use the Session VWAP indicator on AiTraderView to trade ...

SMC Indicator Explained | AiTraderView Tutorial
Learn how to use the SMC (Smart Money Concepts) indicator on ...

Squeeze Check Indicator Explained | AiTraderView Tutorial
Learn how to use the Squeeze Check indicator on AiTraderView to spot ...
Swing High/Low Marker Explained | AiTraderView Tutorial
Learn how to use the Swing High/Low Marker on AiTraderView to ...

Volume Profile Indicator Explained | AiTraderView Tutorial
Learn how to use the Volume Profile indicator on AiTraderView to see ...

Auto Trendlines Indicator Explained | AiTraderView Tutorial
Learn how to use the Auto Trendlines indicator on AiTraderView to see ...

Candlestick Patterns Indicator Explained | AiTraderView Tutorial
Learn how to use the Candlestick Patterns indicator on AiTraderView to ...